
Figures & data
Figure 1 Flowchart of participants who were included in the study. A total of 4869 participants were recruited at baseline, of whom 178 had incomplete dietary data, 378 had a family history of T2DM and 389 were newly defined as having T2DM. A total of 1915 patients were lost during follow-up or had incomplete data. After excluding the abovementioned participants, a total of 2009 subjects were included in the study.
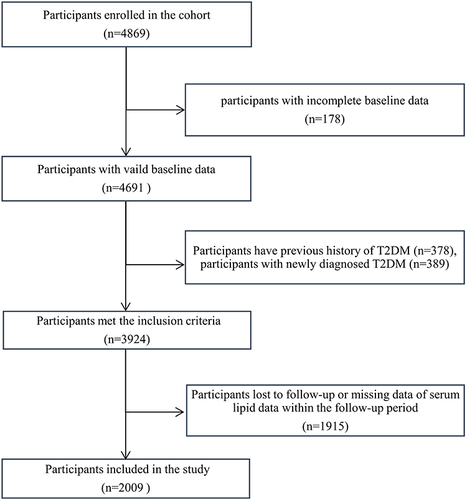
Table 1 Sociodemographic Factors of Baseline Participants
Table 2 Laboratory Parameters of Baseline Participants
Table 3 Dietary Intake of Participants/Day (g)
Figure 2 Z score radar plot of daily food intake between new-onset T2DM patients and participants without diabetes. The radar plot reflected the Z scores of the intake of 7 food groups between new-onset T2DM and participants without diabetes. The dots represent the Z score value for each food group in the new-onset T2DM (Orange dots) and without diabetes groups (green dots). Patients with new-onset T2DM had a higher intake of refined grains, red meat and eggs.
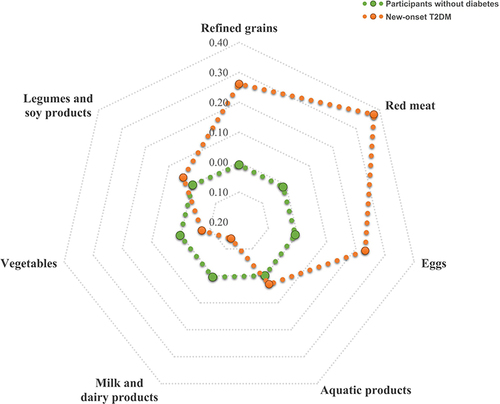
Figure 3 Incidence of T2DM with different quartile changes in cumulative lipid parameter burden. The four-line graph representing the incidence of T2DM with different quartile changes in cumulative TG (A), LDL (B), HDL (C) and TC (D) burden.
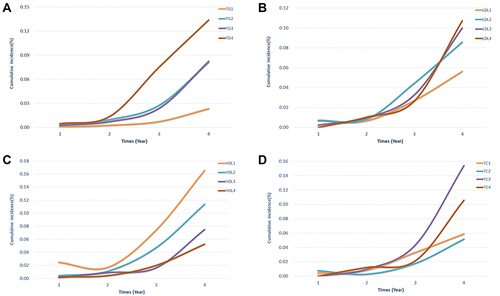
Figure 4 HRs (95% CI) and P values for T2DM and ascending quartiles of cumulative lipid parameter burden. Model I: unadjusted. Model II: adjusted for age, sex, marital status and family history of diabetes. Model III: adjusted for age, sex, marital status, family history of diabetes, cumulative SBP burden, cumulative DBP burden and cumulative BMI burden. Model IV: adjusted for age, sex, marital status, family history of diabetes, cumulative SBP burden, cumulative DBP burden, cumulative BMI burden, refined grains and red meat and egg intake.
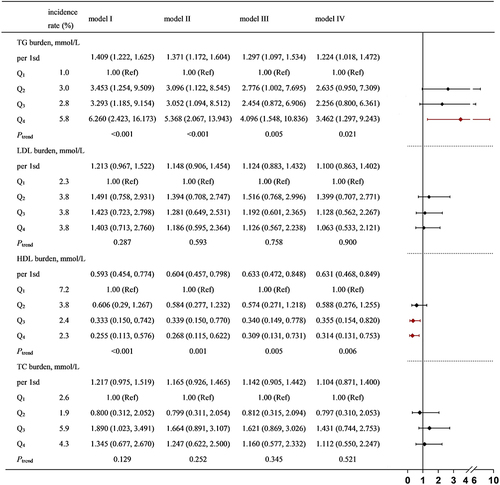
Figure 5 Sensitivity analysis for T2DM and cumulative lipid parameter burden. Model I: unadjusted. Model II: adjusted for age, sex, marital status and family history of diabetes. Model III: adjusted for age, sex, marital status, family history of diabetes, cumulative SBP burden, cumulative DBP burden and cumulative BMI burden. Model IV: adjusted for age, sex, marital status, family history of diabetes, cumulative SBP burden, cumulative DBP burden, cumulative BMI burden, refined grains and red meat and egg intake.
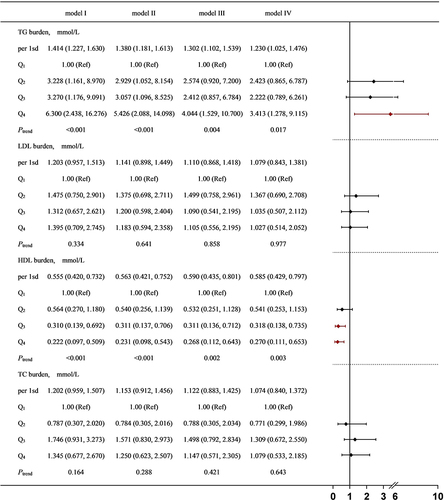
Table 4 The Relationship Between Food Related to the Onset of T2DM and Cumulative Lipid Parameter Burden β (95% CI for β) ×10−3
Table 5 Mediating Analysis of Dietary and Cumulative Lipid Parameter Burden and T2DM