Figures & data
Table 1 Clinical Characteristics of the T2DM Adults Ranging from Normal Weight to Obesity Grouped by the Median of SMM/BFM in Men
Table 2 Clinical Characteristics of the T2DM Adults Ranging from Normal Weight to Obesity Grouped by the Median of SMM/BFM in Women
Figure 1 BMD calculated with Z score or T score is enhanced in the high SMM/BFM group in men. Low or high group are divided by the median of SMM/BFM, which is 1.7 in men. Low group: SMM/BFM ≤ 1.7; high group: SMM/BFM > 1.7. (A–C) BMD calculated with Z score in normal weight (A), overweight (B) and obese I (C); (D–F) BMD calculated with T score in normal weight (D), overweight (E) and obese I (F). ***P < 0.001.
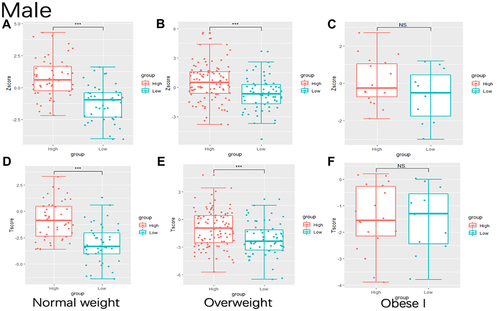
Figure 2 BMD calculated with Z score or T score is enhanced in the high SMM/BFM group in women. Low or high group are divided by the median of SMM/BFM, which is 1.0 in women. Low group: SMM/BFM ≤ 1.0; high group: SMM/BFM > 1.0. (A–C) BMD calculated with Z score in normal weight (A), overweight (B) and obese I (C); (D–F) BMD calculated with T score in normal weight (D), overweight (E) and obese I (F). **P < 0.01, ***P < 0.001.
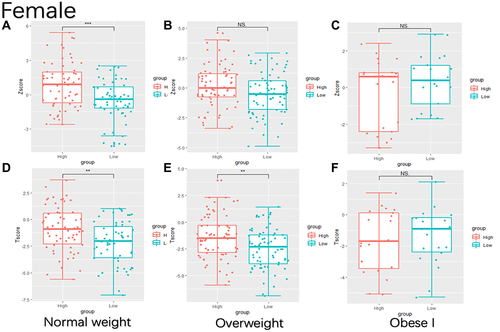
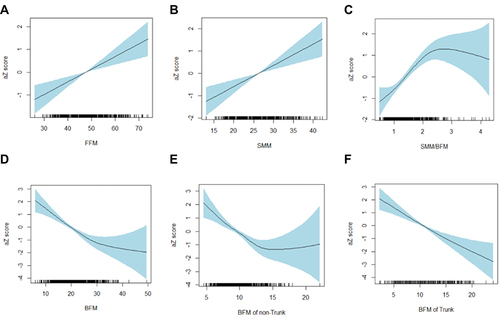
Table 3 Different Generalized Additive Analysis Models Between Body Composition and Adjusted Z-Score
Figure 3 Generalized additive relations of different body compositions with aZscore. aZscore and its generalized additive models with FFM (A), SMM (B), SMM/BFM (C), BFM (D), BFM of non-trunk (E) and BFM of Trunk (F). aZscore: Z score adjusted with age, gender, BMI, and HbA1c. Areas marked by blue: confidence intervals.