Figures & data
Table 1 Demographic and Biochemical Parameters Between NAFLD Patients and Controls
Table 2 Difference Between Groups Regarding Serum Proneurotensin and Micro-RNA-122 Assay
Table 3 Correlation Between Each of Serum Proneurotensin and Micro-RNA-122 and Other Measured Variables in NAFLD Group
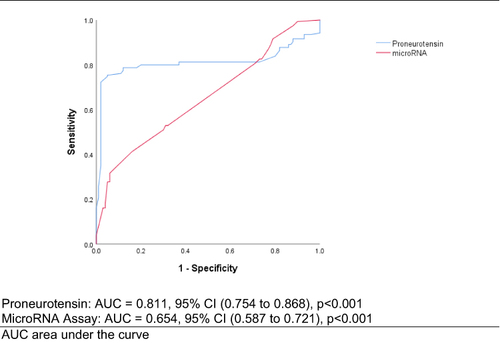
Figure 1 Box-and-whisker plot chart showing difference between groups regarding: (A) serum proneurotensin, (B) serum micro-RNA-122.
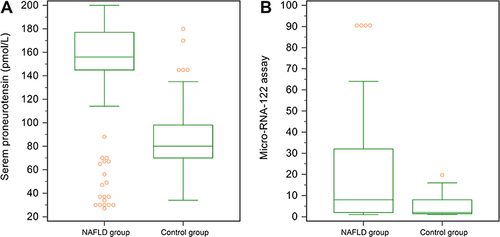
Table 4 Cut off Value of Pro-Neurotensin and microRNA 122 in Diagnosis of NAFLD
Figure 2 ROC curve for diagnosis of pro-neurotensin and microRNA 122 assay in NAFLD patients.