
Figures & data
Figure 1 Study design.
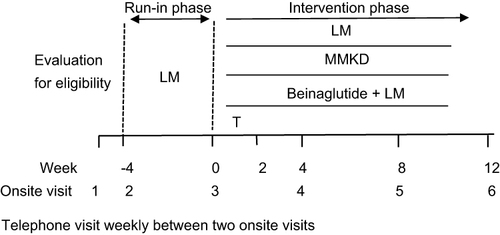
Figure 2 Flow-chart of participant enrollment process.
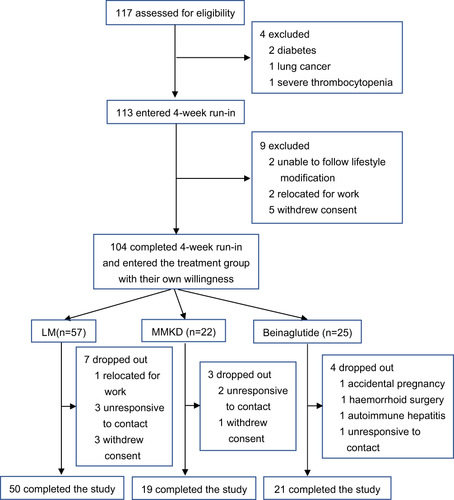
Table 1 Baseline Characteristics of the Study Participants After the 4-Week Run-in
Figure 3 Changes in body weight and composition. (A) Change in body weight over time during the study. (B) Change in body weight from week 0 to 12. (C) Change in skeletal muscle mass from week 0 to 12. (D) Change in fat mass from week 0 to 12. (E) Change in body fat percentage from week 0 to 12. (F) Change in visceral fat area from week 0 to 12. (G) Percentage of participants in each intervention group who had a total weight loss of at least 5% or10% of the initial body weight at week 0. (H) Mean weight loss percentage in each group after the 12-week intervention.
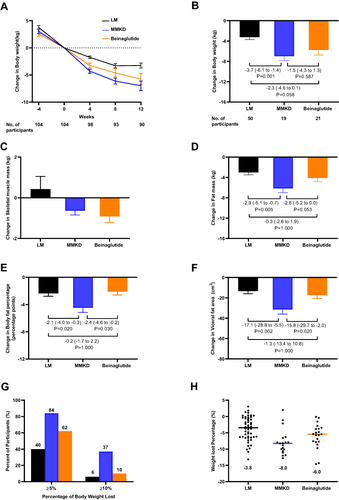
Table 2 Treatment Effects for Metabolic Variables Before and After the 12 Weeks of Intervention
Table 3 Adverse Events During the Study