Figures & data
Table 1 Primer Sequences Used for RT-PCR Analysis
Figure 1 Comparison of general conditions and biochemical indices in three groups of rats. Sac can improve renal hypertrophy, proteinuria, serum albumin, glucose metabolism, Scr and DUN levels in early DN rats. (A) Body weights of rats in the three groups.(B) Kidney weights of the three groups of rats. (C) Ratio of kidney weight/body weight in the three groups of rats. (D) Glucose of the three groups of rats. (E) Urine protein levels in the three groups of rats. (F) Albumin of the three groups of rats. (G) Creatinine levels in the three groups of rats. (H) Urea nitrogen levels in the three groups of rats. Data are expressed as mean ± standard deviation, *P<0.05; **P<0.01; ***P<0.001; ns: P>0.05.
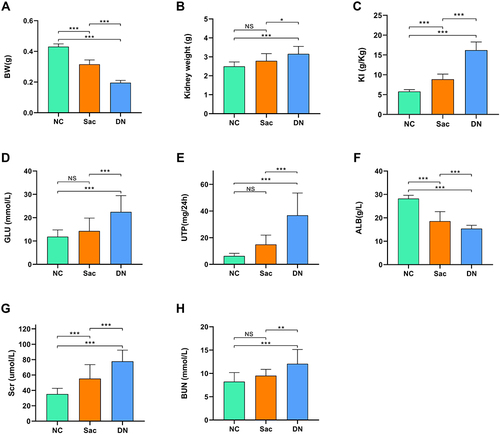
Figure 2 Comparison of renal pathological features in three groups of rats. (A) Sac ameliorates glomerular hypertrophy and interstitial inflammatory cell infiltration in early diabetic nephropathy. (B) Mean glomerular area of rats in the three groups. (C) Mean glomerular volume of the three groups of rats. Data are expressed as mean ± standard deviation; ***P<0.001; ns: P>0.05.
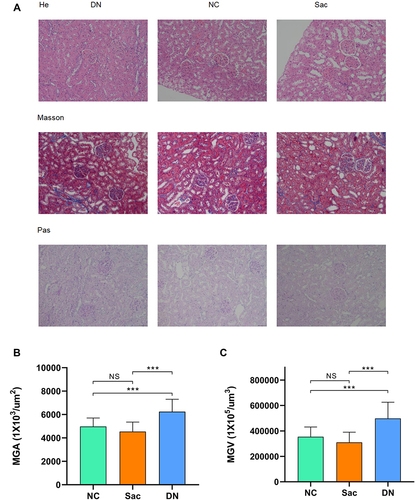
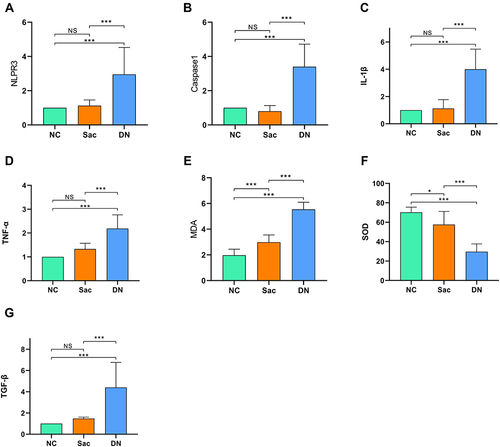
Figure 3 Comparison of the expression levels of inflammation, oxidative stress and fibrosis in the kidney tissues of three groups of rats. Sac down-regulates TNF-a, MDA and TGF-β1 expression levels through inhibition of the NLRP3 inflammasome pathway, thus exerting to improve the inflammatory response, oxidative stress and fibrotic response in the diabetic kidney. (A) NLRP3 of rats in the three groups.(B) Caspase-1 of the three groups of rats. (C) IL-1β of the three groups of rats. (D) TNF-α of the three groups of rats. (E) MDA of the three groups of rats. (F) SOD of the three groups of rats. (G) TGF-β1 of the three groups of rats. Data are expressed as mean ± standard deviation, *P<0.05; ***P<0.001; ns: P>0.05.