Figures & data
Figure 1 Experimental design and treatment schedule.
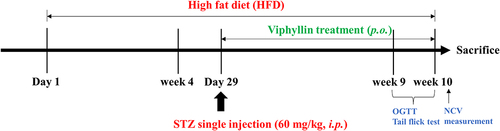
Figure 2 Effect of Viphyllin on body weight and organ indices in diabetic rats. (A) Weekly measurement of body weight. The data were analyzed by two-way ANOVA followed by Tukey’s test. (B and C) Changes in liver and kidney indices. The data were analyzed by one-way ANOVA followed by Tukey’s test. Values are expressed as mean±SD (n=5). #p<0.05, ##p<0.01 and ###p<0.001 vs control; *p<0.05, **p<0.01 and ***p<0.001 vs diabetic control.
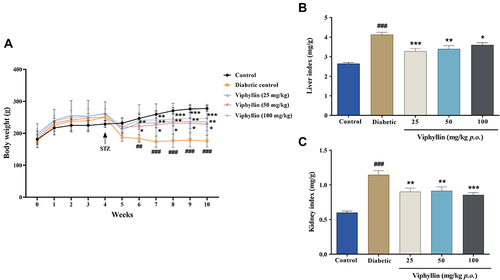
Figure 3 Effect of Viphyllin on glucose tolerance in diabetic rats. (A) Blood glucose concentrations measured at time 0 and after oral administration of (1 g/kg body weight) glucose. (B) Area under the curve (AUCglucose) from 0–120 min after the oral administration of glucose. (C) Fasting blood glucose at the end of study. The data were analyzed by one-way ANOVA followed by Tukey’s test. Values are expressed as mean±SD (n=5). ##p<0.05 and ###p<0.001 vs control; *p<0.05 and ***p<0.001 vs diabetic control.
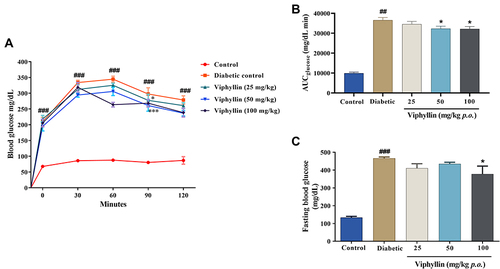
Figure 4 Effect of Viphyllin on tail flick latency in diabetic rats. The data were analyzed by one-way ANOVA followed by Tukey’s test. Values are expressed as mean±SD (n=5). ###p<0.001 vs control; *p<0.05 vs diabetic control.
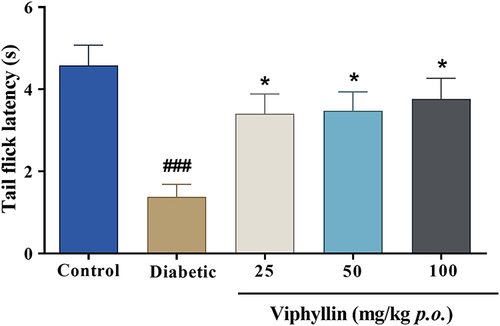
Figure 5 Effect of Viphyllin on nerve conduction velocity (NCV) (A) and antioxidant status (B–D) in sciatic nerve tissue. The data were analyzed by one-way ANOVA followed by Tukey’s test. Values are expressed as mean±SD (n=5). #p<0.05 and ###p<0.001 vs control; *p<0.05, **p<0.01 and ***p<0.001 vs diabetic control.
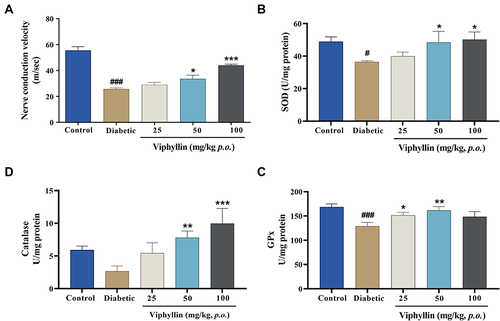
Figure 6 Effect of Viphyllin on serum lipid profile of diabetic rats. The data were analyzed by two-way ANOVA and presented as mean±SD (n=5). Values are mean±SD (n=5). #p<0.05 and ###p<0.001 vs control; *p<0.05 and ***p<0.001 vs diabetic control.
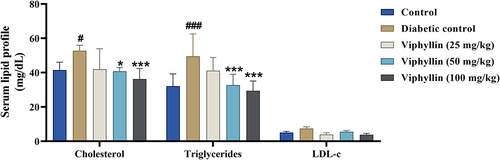
Figure 7 Effect of Viphyllin on serum levels of renal health markers in diabetic rats. (A) Creatinine, (B) uric acid, and (C) blood urea nitrogen. The data were analyzed by one-way ANOVA followed by Tukey’s test. Values are mean±SD (n=5). #p<0.05 and ###p<0.001 vs control; *p<0.05 and **p<0.01 vs diabetic control.
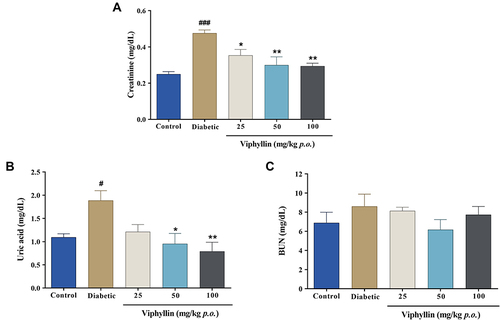
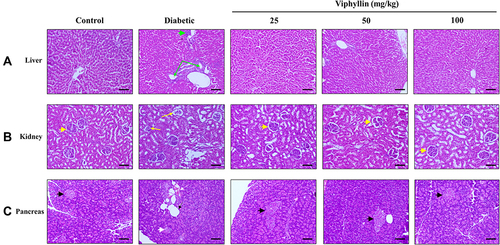
Figure 8 Effect of Viphyllin on histopathology of vital organs in diabetic rats. Representative images (H&E staining) showing histological changes in liver (A), kidney (B) and pancreas (C). Green arrowhead: inflammation; green arrows: biliary hyperplasia; yellow arrowhead: normal glomeruli; yellow arrows: glomerular atrophy; black arrowhead: normal islets of Langerhans; white arrowhead: atrophy of islets of Langerhans; black arrow: islets emptied; white arrow: congestion. (Magnification: ×100; scale bar: 100 µm).