Figures & data
Figure 1 Identification and GO analysis of DEGs in glomeruli. (A) Sample normalization; (B) PCA of glomerular genes; (C) UMAP of glomerular genes; (D) volcanic map of DEGs in glomeruli; (E) GO analysis of DEGs in glomeruli (top 26).
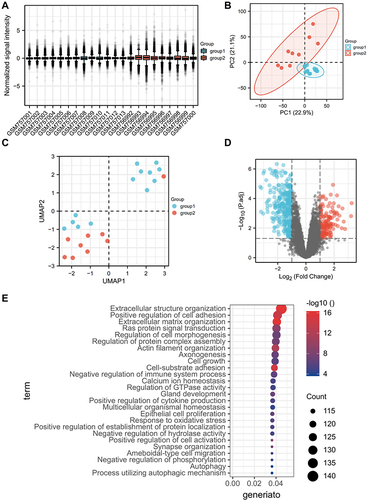
Figure 2 Identification and GO analysis of DEGs in renal tubular interstitium. (A) Sample normalization; (B) PCA of genes in renal tubulointerstitium; (C) UMAP of genes in renal tubulointerstitium; (D) volcanic map of DEGs in renal tubular interstitium; (E) GO analysis of DEGs in renal tubulointerstitium (top 26).
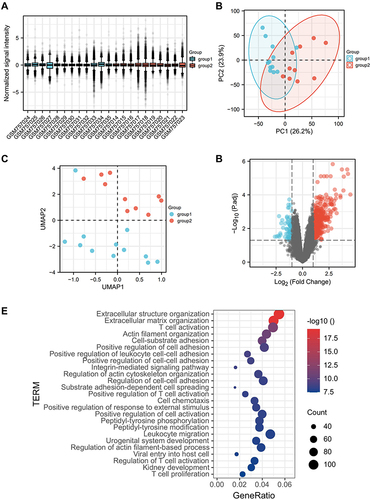
Table 1 Baseline Demographic Data of Patients and p62 Protein Expression of Renal Tissue
Figure 3 The expressions of the P62 protein in human renal tissues were significantly increased in the DKD group patients with macroalbuminuria, mainly in the podocytes. (A) IHC staining of P62 protein in human renal tissues; (B) double immunofluorescence staining of P62 and WT-1 in human renal tissue of DKD2 group. (C) Double immunofluorescence staining of P62 and CD31 in human renal tissue of DKD2 group. (D) Double immunofluorescence staining of P62 and PDGFR-β in human renal tissue of DKD2 group. Data are expressed as mean ± standard deviation (SEM). Scale bar = 50 μm; *p < 0.05, ***p < 0.001.
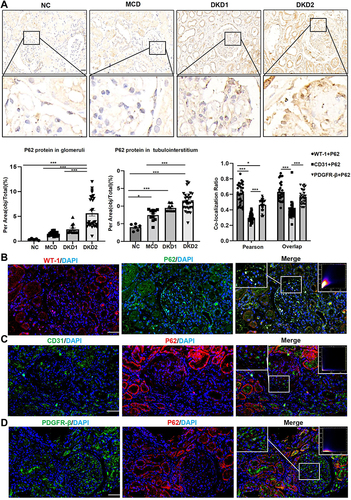
Table 2 Clinical Data of Patients with DKD
Table 3 Comparison of Pathological Data of DKD Patients
Table 4 Correlation Analysis of P62 Protein Level on Glomerulus and Clinicopathological Data of DKD Group
Table 5 Stepwise Regression Analysis
Table 6 Binary Logistic Regression Analysis
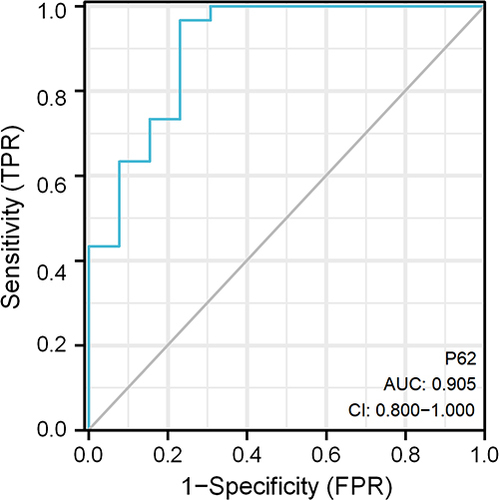
Table 7 ROC Curve Analysis of P62 Protein on Glomerulus of DKD Patients
Figure 4 ROC curve analysis of glomerular P62 protein in DKD patients.