
Figures & data
Table 1 Revisions to GDAQ
Table 2 Final Factor Loadings for Scales by Respondent Group
Figure 1 Principal component analysis results for total sample: Scree plot and variance explained for NG rating items.
Abbreviation: NG, nasal glucagon.
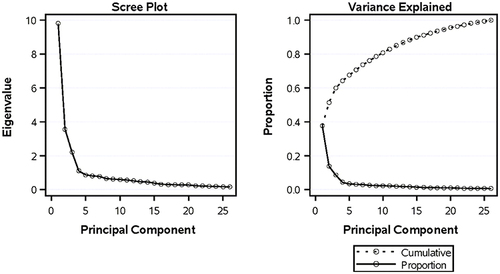
Figure 2 Principal component analysis results for total sample: Scree plot and variance explained for AI rating items.
Abbreviation: AI, autoinjector glucagon.
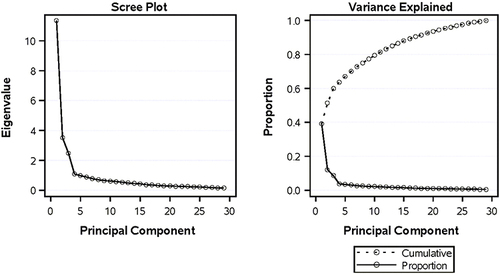
Table 3 Fit Metrics for Confirmatory Factor Analysis
Table 4 Descriptive Statistics for Device Rating Items Not Included in Factor Analyses by Respondent Group
Table 5 Cronbach’s Alpha for Final Scales by Respondent Group
Table 6 Correlations of Scales with Global Item by Respondent Group