Figures & data
Table 1 Clinical Characteristics of All Participants with T2DM
Table 2 Characteristics of Imaging Markers of CSVD of All Participants with T2DM
Table 3 Analysis of the Association Between Different Imaging Markers of CSVD and MCI in Patients with T2DM
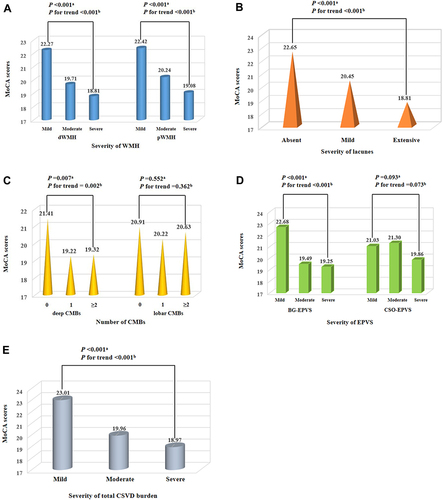
Figure 1 Distribution of mean values of MoCA scores according to WMH, lacunes, CMBs, EPVS and total CSVD burden. MoCA scores were negatively associated with the severity of WMH (both of dWMH and pWMH), lacunes, deep CMBs, BG-EPVS, and total CSVD burden ((A–E) respectively).
Notes: aKruskal–Wallis test; bJonckheere–Terpstra test.
Abbreviations: CSVD, cerebral small vessel disease; dWMH, deep white matter hyperintensity; pWMH, periventricular white matter hyperintensity; CMBs, cerebral microbleeds; BG-EPVS, basal ganglia-enlarged perivascular spaces; CSO-EPVS, centrum semiovale-enlarged perivascular spaces.