
Figures & data
Table 1 Comparisons of Baseline Characteristics and Hormonal Profile Among Three Groups of T2DM Subjects
Figure 1 Compared with VFA normal group, plasma levels of deacylated ghrelin (DAG) were significantly lower in two VFA obesity groups (**P<0.01).
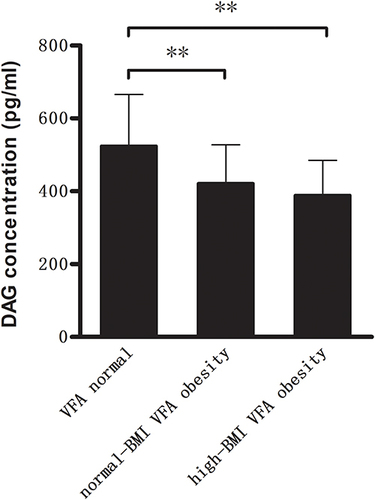
Figure 2 Compared with VFA normal group, the two VFA obesity groups showed no significant difference in the plasma levels of acylated ghrelin (AG) (ns.P>0.05).
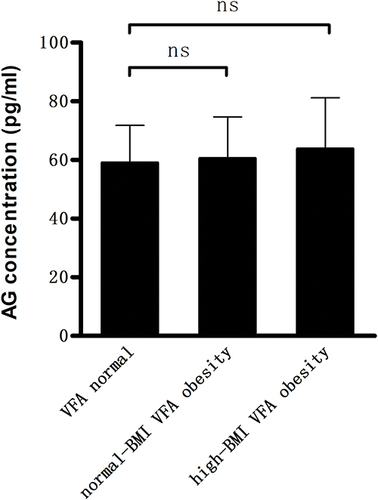
Table 2 Correlations Between AG, DAG and AG/DAG Ratio and Other Variables in All Subjects
Table 3 Multiple Stepwise Regression Analysis of AG Concentration and Other Variables in All Subjects
Table 4 Multiple Stepwise Regression Analysis of DAG Concentration and Other Variables in All Subjects