Figures & data
Table 1 Baseline Characteristic Comparisons According to General Obesity
Table 2 CMR Baseline Characteristics
Figure 1 Percentage MVO and infarct size according to body mass index category.
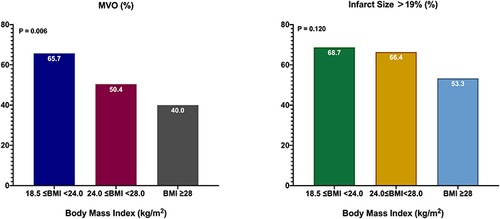
Table 3 Univariable and Multivariable Predictors of Presence of MVO
Table 4 Multivariable Adjusted Difference in LV Parameters and AAR per Unit Increase in Body Mass Index
Table 5 Multivariable Adjusted Difference in LV Parameters and AAR According to Body Mass Index Category
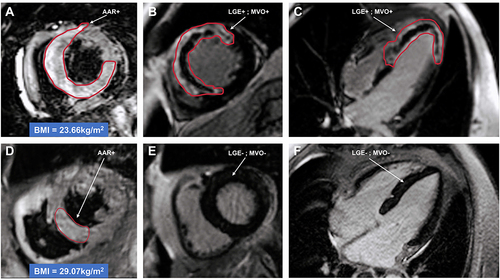
Figure 2 CMR of 2 patients with 18.5 ≤BMI <24.0 kg/m2 and BMI ≥28 kg/m2 after anterior STEMI and successful PPCI. The top row (A–C) showed a patient with BMI = 23.66 kg/m2, the bottom row (D–F) showed a patient with BMI = 29.07 kg/m2. (A and D) T2-weighted imaging was used to detect AAR. (B, C, E and F) T1-weighted imaging in LV short and long axis was used to detect LGE and MVO. Despite similar clinical characteristics for 2 groups, patient in 18.5 ≤BMI <24.0 kg/m2 group showed both LEG and MVO that were not present in BMI ≥28 kg/m2 group.