Figures & data
Figure 1 (A) Body weights measured at the end of experiment for C57/Bl6, IL-12−/−, CHOP−/−, db−/db−, db−/db−IL−12-/-, and db−/db-chop-/- mice. Data are expressed as mean ± S.E.M. One way ANOVA was used for comparison between the groups followed by Tukey’s post-hoc test. *p<0.05 for db−/db− vs C57/Bl6, IL-12−/−, and CHOP−/−. #p<0.05 for db−/db−chop-/- vs C57/Bl6, IL-12−/−, and CHOP−/−. &p<0.05 for db−/db−IL12-/- vs C57/Bl6, IL-12−/−, and CHOP−/− mice. (B) Glucose tolerance test (GTT) of C57/Bl6, IL-12−/−, CHOP−/−, db−/db−, db−/db−IL−12-/-, and db−/db-chop-/- mice. Data are expressed as mean ± SEM. Two-way ANOVA was used for comparison between the groups followed by Tukey’s post-hoc test. *p<0.05 for db−/db− vs C57/Bl6, IL-12−/−, CHOP−/−, db−/db−IL−12-/-, and db−/db-chop-/.
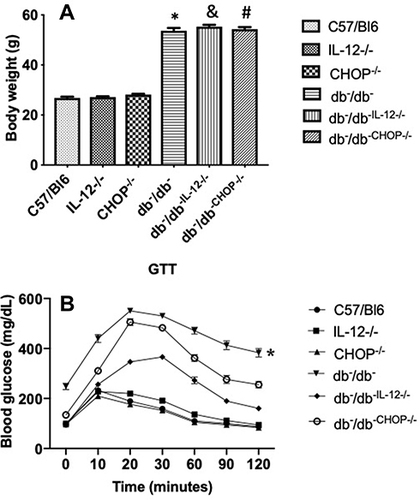
Figure 2 Mesenteric resistance arteries reactivity showing (A) endothelium-independent relaxation in response to sodium nitroprusside (SNP). (B) endothelium-dependent relaxation in response to acetylcholine (ACh). (C) contractility in response to sympathetic stimulation by phenylephrine (PE) in C57/Bl6, IL-12−/−, CHOP−/−, db−/db−, db−/db−IL−12-/-, and db−/db-chop-/- mice. Data are expressed as mean ± SEM. Two-way ANOVA was used for comparison between the groups followed by Tukey’s post-hoc test. *p<0.05 for db−/db− vs C57/Bl6, IL-12−/−, CHOP−/−, db−/db−IL−12-/-, and db−/db-chop-/- mice.
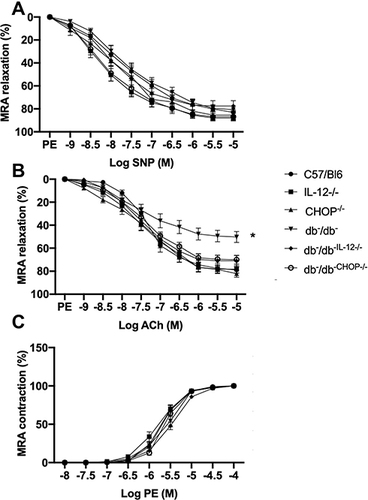
Figure 3 Western blot analysis of survival markers (A) Phosphorylated and total AMPK. (B) Phosphorylated and total eNOS. (C) Phosphorylated and total Akt. β-actin was used as a loading control. Data are expressed as % compared to control. One way ANOVA was used for comparison between the groups followed by Tukey’s post-hoc test. *p<0.05 for db−/db− vs C57/Bl6, IL-12−/−, CHOP−/−, db−/db−IL−12-/-, and db−/db-chop-/- mice.
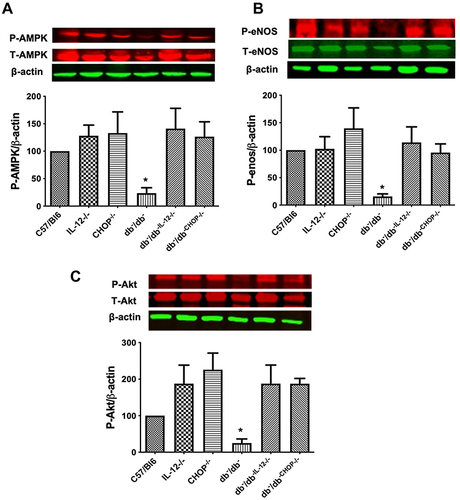
Figure 4 Western blot analysis of ER markers (A) CHOP. (B) BIP. β-actin was used as a loading control. Data are expressed as % compared to control. One way ANOVA was used for comparison between the groups followed by Tukey’s post-hoc test. *p<0.05 for db−/db− vs C57/Bl6, IL-12−/−, CHOP−/−, db−/db−IL−12-/-, and db−/db-chop-/- mice.
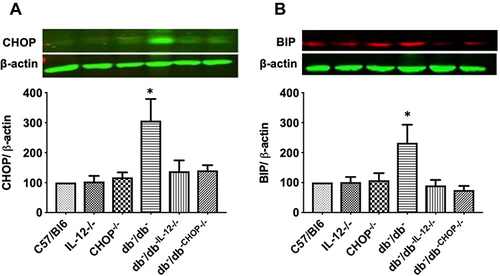
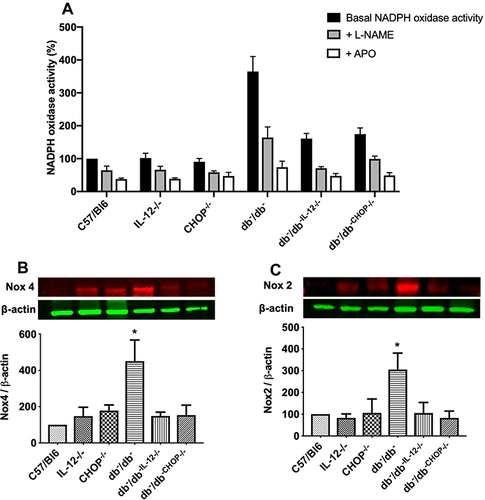
Figure 5 (A) NADPH oxidase activity with and without incubation with L-NAME and Apocynin (APO) in mesenteric resistance arteries from C57/Bl6, IL-12−/−, CHOP−/−, db−/db−, db−/db−IL−12-/-, and db−/db-chop-/- mice. Data were normalized to protein content and are expressed as % compared to control. One way ANOVA was used for comparison between the groups followed by Tukey’s post-hoc test. *p<0.05 for db−/db− vs C57/Bl6, IL-12−/−, CHOP−/−, db−/db−IL−12-/-, and db−/db-chop-/- mice. Western blot analysis of oxidative stress markers (B) Nox 4. (C) Nox 2. β-actin was used as a loading control. Data are expressed as % compared to control. One way ANOVA was used for comparison between the groups followed by Tukey’s post-hoc test. *p<0.05 for db−/db− vs C57/Bl6, IL-12−/−, CHOP−/−, db−/db−IL−12-/-, and db−/db-chop-/- mice.