Figures & data
Table 1 Baseline Characteristics of Patients Before and After IPTW
Figure 1 Flowchart of the study cohorts.
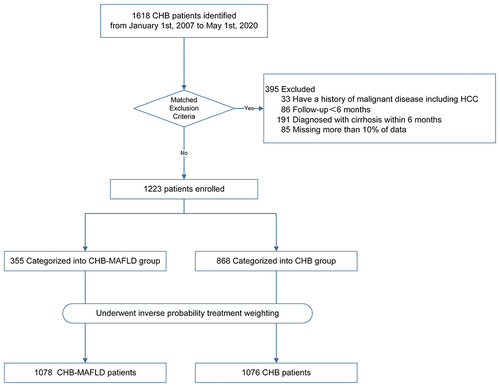
Figure 2 Metabolic characteristics of patients in the CHB-MAFLD group. In the CHB-MAFLD group, the proportions of patients with BMI ≥ 23 kg/m2, with BMI < 23 kg/m2 and metabolic dysfunctions, with BMI < 23 kg/m2 and DM were 85.64%, 11.83%, and 2.53%, respectively (A), while 82.53% of these CHB-MAFLD patients had at least one metabolic risk factor (B).
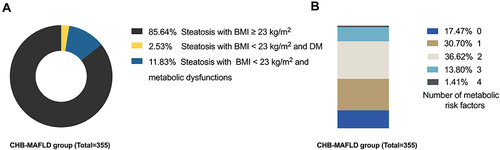
Figure 3 Cumulative incidence of cirrhosis per year after IPTW. The different weighted cumulative incidence of cirrhosis per year between the CHB-MAFLD group and the CHB group after IPTW.
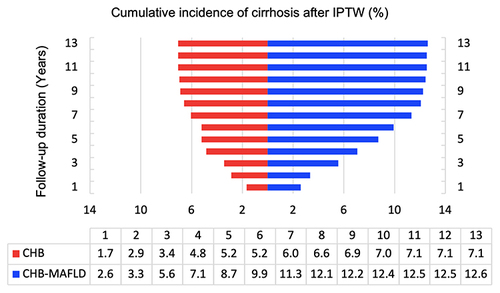
Figure 4 Cumulative incidence of cirrhosis after IPTW. The cumulative incidence of cirrhosis in the CHB-MAFLD group was significantly higher than that in the CHB group (12.6% and 7.1%, respectively, P=0.015).
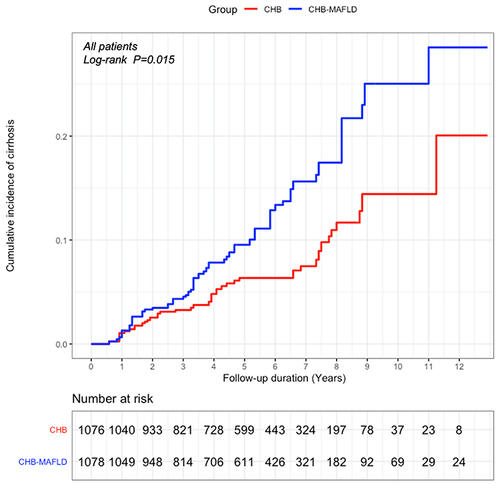
Figure 5 Cumulative incidence of cirrhosis after IPTW, by antiviral treatment status.
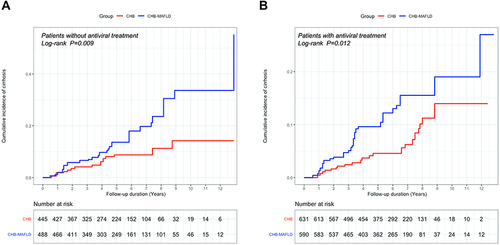
Table 2 Weighted Univariate and Multivariate Cox Analysis of Risk Factors Related to Cirrhosis After IPTW
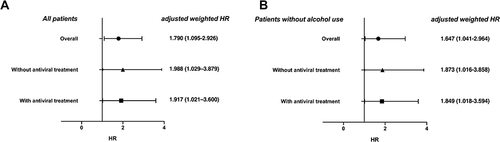
Figure 6 Subgroup analysis of cirrhosis risk after IPTW, by antiviral treatment status.