Figures & data
Table 1 Demographic and Clinical Characteristics of Type 2 Diabetic (T2DM) Patients
Figure 1 Serum levels of TMAO in diabetic patients (a) without and (b) with MCI. All data are expressed as medians and inter-quartile ranges (IQR). Mann–Whitney U-tests were performed to compare the differences between groups. ***P<0.001 vs healthy control group.
Abbreviation: MCI, mild cognitive impairment.
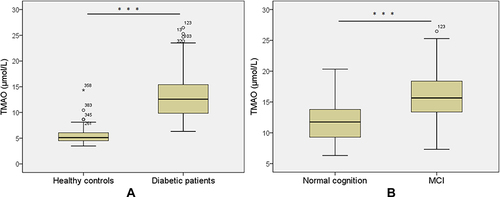
Table 2 The Correlations of Serum TMAO Level with Clinical Indicators in T2DM Patients
Table 3 Multivariate Logistic Regression Evaluates the Risk of MCI in T2DM Patients
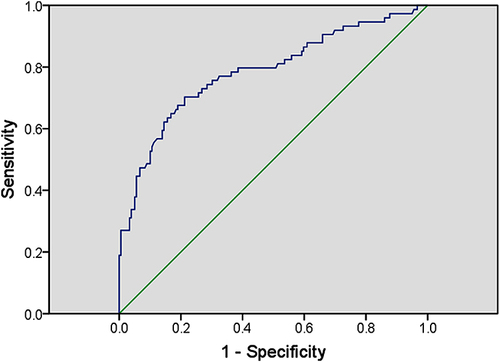
Figure 2 Receiver operator characteristic (ROC) curve of serum TMAO. The ROC curve was plotted to determine the cut-off point for serum TMAO that distinguishes the MCI and non-MCI in diabetic patients.
Abbreviation: MCI, mild cognitive impairment.