Figures & data
Figure 1 Flowchart for the selection of study subjects.
Abbreviations: ACR, urinary microalbumin to creatinine ratio; SCR, serum creatinine; CKD, chronic kidney disease; METS-VF, Metabolism Score for Visceral Fat.
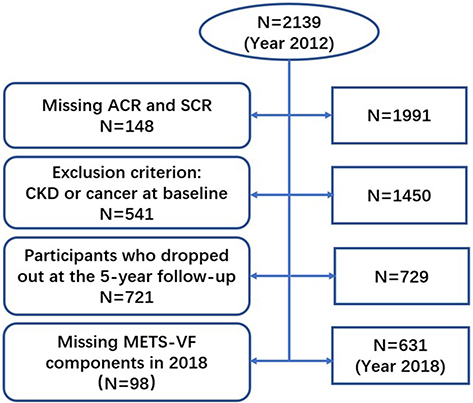
Table 1 Clinical and Demographic Characteristics of Participants
Table 2 Multivariable Logistic Regression to Analyze the Correlation Between Metabolic Score for Visceral and CKD Risk
Figure 2 Subgroup analyses of the association between metabolic score for visceral fat and CKD risk.
Abbreviations: OR, odd ratios; CI, confidence interval; METS-VF, Metabolism Score for Visceral Fat.
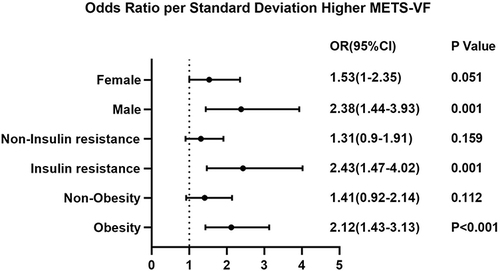
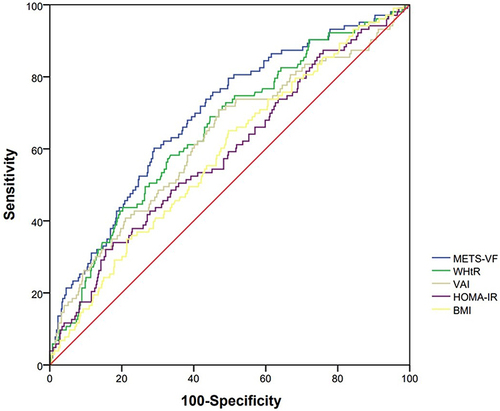
Table 3 Comparison of Values for Area Under the Receiver Operating Characteristic Curve for METS-VF, WHtR, VAI, HOMA-IR, and BMI with CKD Risk
Figure 3 Comparison of the correlation between METS-VF, WHtR, VAI, HOMA-IR, and BMI and CKD risk.
Abbreviations: METS-VF, Metabolism Score for Visceral Fat; WHtR, waist-to-height ratio; VAI, Visceral Adiposity Index; HOMA-IR, homeostatic model assessment of insulin resistance; BMI, body mass index.