Figures & data
Figure 1 LGZGD reduced the obesity process in IR rats. (A) Weekly body weight curves. (B) Bodyweight gain from week 2 to week 18. (C) Weight of the epididymal fat. (D) Blood glucose changes during the OGTT. (E) The area under the OGTT curves. (F) Fasting plasma insulin, (G) HOMA-IR index. (H) NEFA. (I) TG. (J) TC. (K) ALT. (L) AST. Data are expressed as the mean ± SEM (n = 3–8 per group). HFD vs ND, #p<0.05, ##p<0.01, ###p<0.001,####p<0.0001; HFD-LGZG vs HFD, *p<0.05, **p<0.01, ***p<0.001.
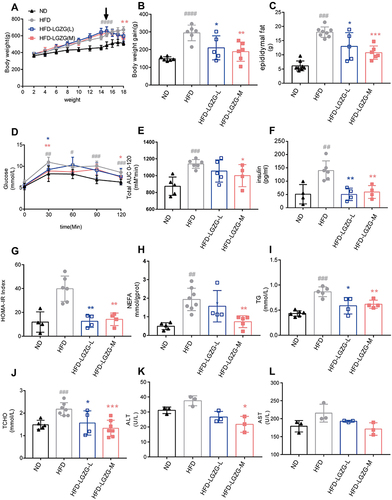
Figure 2 LGZGD attenuated hepatic steatosis in IR rats. (A) Representative images of liver H&E staining (scale bar, 100 μm). (B&D) Representative images (B) and quantification (D) of liver oil red O staining (scale bar, 100 μm). (C and E) Immunohistochemistry staining (C) and optical density (OD) quantification (E) of liver for CD36 (scale bar, 100 μm). Data are expressed as the mean ± SEM (n =3 per group). HFD vs ND, ##p<0.01, ###p<0.001; HFD-LGZG vs HFD, *p<0.05, **p<0.01. In the present test, HFD-LGZG is HFD-LGZG-M.
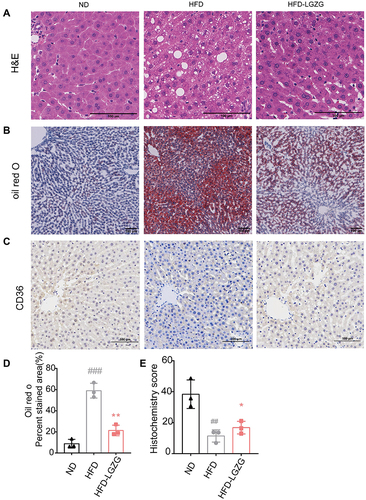
Figure 3 LGZGD ameliorated the integrity of the intestinal barrier in IR rats. (A) Representative images of ileum H&E staining (scale bar, 100 μm). (B&C) The quantification of villus height (B) and crypt depth (C) of the ileum. (D and E) Immunohistochemistry staining (D)and optical density (OD) quantification (E) of occludin in the ileum (scale bar, 100 μm). Data are expressed as the mean ± SEM (n = 3 per group). HFD vs ND, #p<0.05, ##p<0.01; HFD-LGZG vs HFD, *p<0.05, **p<0.01. In the present test, HFD-LGZG is HFD-LGZG-M.
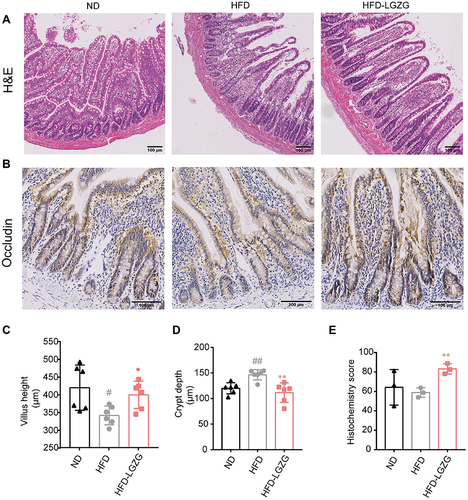
Figure 4 LGZGD restored the dysbiotic fecal microbiota of IR Rats. (A) Alpha diversity of gut microbiota in different groups. (B) Venn diagram showing OTU distribution. (C and D) Weighted UniFrac and unweighted UniFrac distance PCoA. (E) The abundances of gut microbiota constituents at the phylum level and genus level. (F) The relative abundance (pair values) of the microbial genus is shown in a yellow to blue color code (high to low abundance). (n = 6 per group). HFD vs ND, **p <0.01; HFD-LGZG vs ND, **p < 0.01. In the present test, HFD-LGZG is HFD-LGZG-M.
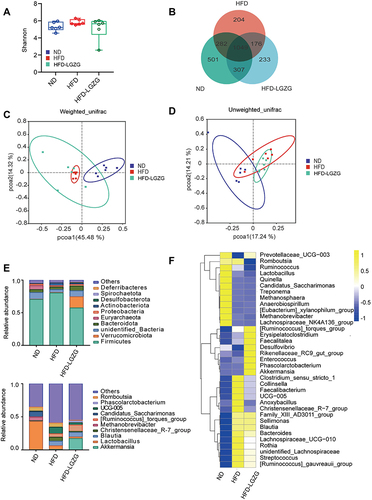
Figure 5 LGZGD regulates the abundance of gut microbial biomarkers in IR rats. (A and B) Histogram and branching plots of LDA value distribution of biomarkers between ND, HFD groups and HFD-LGZG groups, listing the LDA score threshold> 4, indicating higher relative abundance of the corresponding groups, with blue, green and red bars representing significantly increased in ND, HFD and HFD-LGZG groups, respectively, generated by linear discrimination analysis effect size (LEFSe) analysis, showing differences in bacterial abundance. (n = 6 per group). In the present test, HFD-LGZG is HFD-LGZG-M.
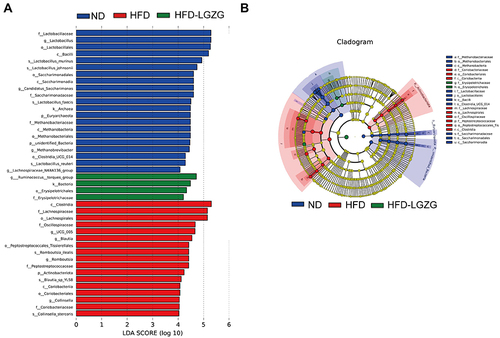
Figure 6 LGZGD altered the colon metabolic profile in IR rats. (A) PCA. Each dot represents an individual rat. (B) Venn diagram. (C and D) Volcano map. (E) Bubble plots of the p values of the metabolic pathways associated with the different metabolites, and the corresponding p values are smaller when the bubbles are larger or darker. (F) Heatmap of the differential metabolites in the ND, HFD and HFD-LGZG groups (VIP > 1, p < 0.05). (n = 6 per group). In the present test, HFD-LGZG is HFD-LGZG-M.
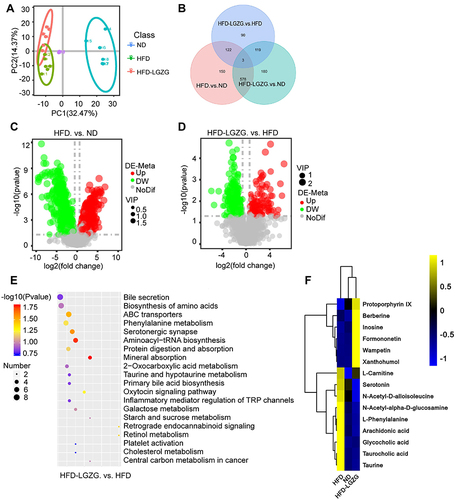
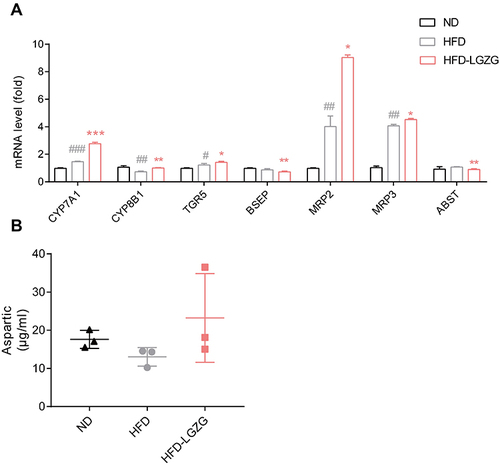
Figure 7 Effect of LGZGD on hepatic bile acid metabolism dysfunction in IR rats. (A) mRNA expression of bile acid synthesis and transport genes in the liver. (B) The concentration of aspartic acid in serum. HFD vs ND, #p < 0.05, ##p < 0.01, ###p < 0.001; HFD-LGZG vs HFD, *p < 0.05, **p <0.01. (n=3 per group). In the present test, HFD-LGZG is HFD-LGZG-M.