
Figures & data
Figure 1 Flowchart showing trial group assignments, loss to follow-up, and analysis.
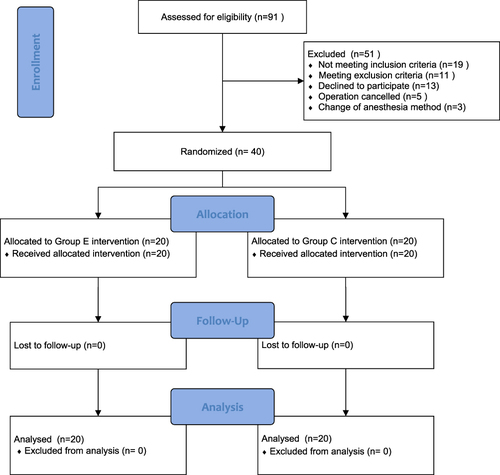
Table 1 General Patient Information (n = 20)
Table 2 Comparison of rSO2baseline, rSO2max and rSO2min Between the Two Groups (n=20)
Table 3 Comparison of the Number of Cases of Intraoperative Changes in Cerebral Oxygen Saturation Between the Two Groups (n=20)
Table 4 Comparison of the Increase or Decrease in Variability of Cerebral Oxygen Saturation Between the Two Groups (n=20)