Figures & data
Table 1 The Preoperative Patients’ Characteristics
Table 2 Operation-Related Indicators
Table 3 The Incidence of Postoperative Complications
Table 4 The Comparison of the Baseline Data Between Successful and Fail Weight Loss Groups at 5 Years (Reviewer #1, Comment #11)
Table 5 Logistic Regression Analysis of Factors for Successful Weight Loss (Reviewer #1, Comment # 15, 16)
Figure 1 The trends in the BMI (A) and %EWL (B) over time.
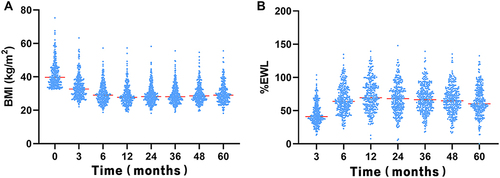
Figure 2 The histograms (A) and probability–probability plots (B) of standardized residuals for %EWL at 5 years.
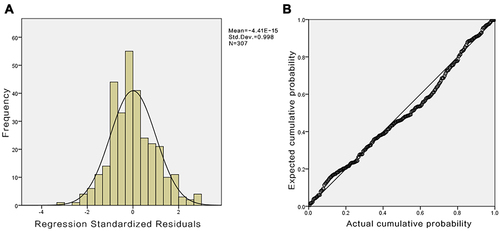
Figure 3 ROC curve of %EWL at 6 months among patients with successful %EWL at 5 years after LSG.
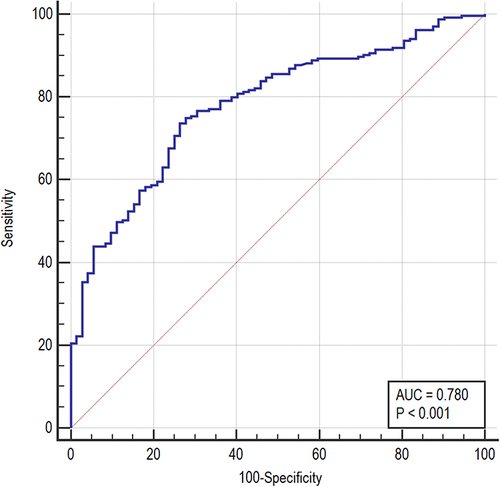
Figure 4 Change in the mean %EWL among patients who achieved 58.57% EWL at 6 months compared to patients who did not.
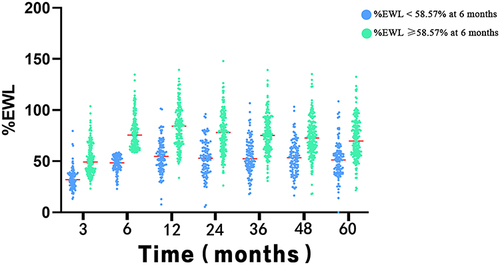
Table 6 Cure Rates of Major Comorbidities in Patients with %EWL ≥ 58.57% and < 58.57% at 6 Months
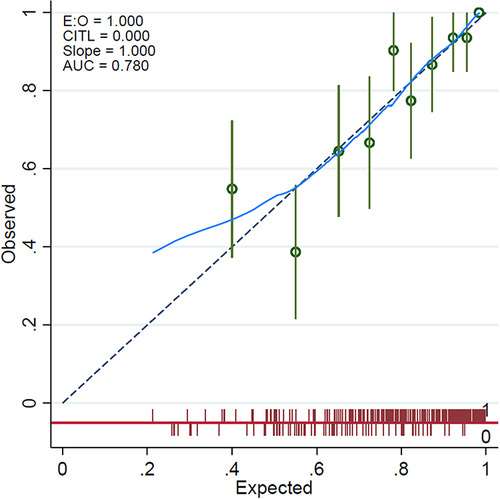
Figure 5 Calibration curve for %EWL at 6 months to predict weight loss at 5 years.