Figures & data
Figure 1 Flowchart of patient selection and grouping.
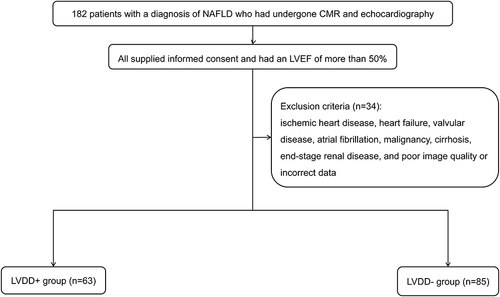
Figure 2 EAT volume calculation in CMR. The EAT region is delineated on short-axis cine slices at end-diastole, from the upper slice limit, marked by the bifurcation of the pulmonary trunk, to the most apical slice. EAT volume is calculated by summing the EAT volume of each slice (8 mm thickness). Representative outputs of EAT delineation in NAFLD patients with and without LVDD are shown in (A and B), respectively.
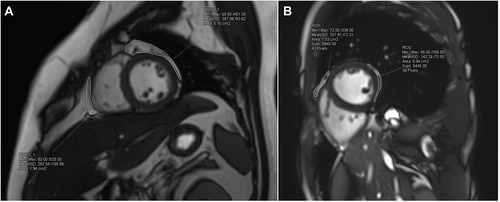
Table 1 Differences in Anthropometric, Biochemical, and Imaging Characteristics Between the LVDD- and LVDD+ Groups
Figure 3 Screening of variables associated with LVDD by LASSO regression model. LASSO coefficient profiles of all variables are plotted in (A). The trajectory of each independent variable coefficient is shown by each differently colored curve. Identification of the penalty regularization parameter (λ) in the LASSO model is achieved by 10-fold cross-validation and the minimum criteria (B). The first dashed line represents the minimum error, while the second represents the cross-validated error within 1 standard error of the minimum value. Eight variables (age, regular exercise, hypertension, T2DM, obesity, HbA1c, LDL-C, and EATVi) are selected by deriving the optimal λ value with the minimum error.
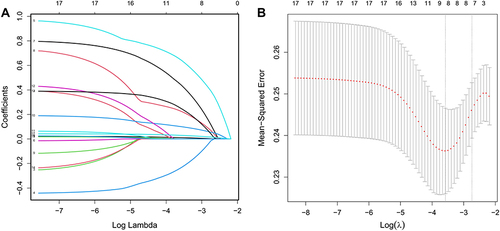
Figure 4 Forest plot of multivariate Logistic regression analysis for independent factors associated with LVDD in NAFLD patients. Number of comorbidities, HbA1c, and EATVi are independently associated with LVDD (all P < 0.05).
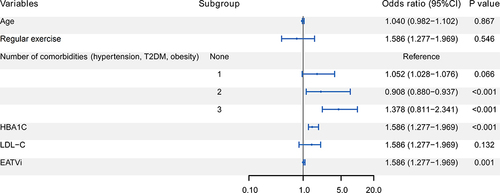
Figure 5 Nomogram for estimating the risk of LVDD in NAFLD patients. Number of comorbidities, HbA1c, and EATVi are included in the nomogram. The point assignment for each factor is shown in the first row. The variables in the nomogram are listed in rows 2–4. The risk of LVDD is presented in the bottom row. For example, in a 50-year-old NAFLD patient with T2DM and hypertension, his HbA1c and EATVi is 7% and 60 cm3/m2, respectively. His total score is about 120, indicating that his risk of LVDD progression is about 60%. It suggests that more aggressive glycemic control and weight reduction should be implemented to keep his risk below 50%.
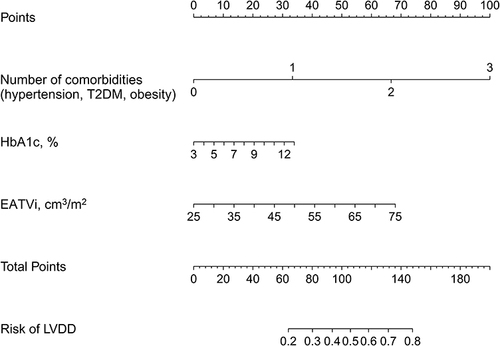
Figure 6 Evaluation of the discrimination and calibration for the established nomogram. ROC curve is plotted for evaluating the discrimination. The AUC is 0.765, indicating moderately good discrimination (A). The calibration curve, which is plotted for evaluating the calibration, indicates that the predicted probability of LVDD matches the actual probability well (B).
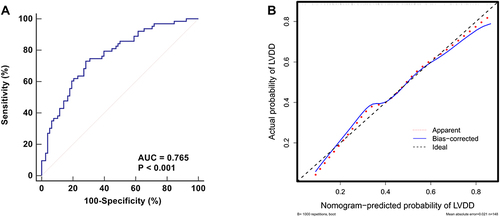
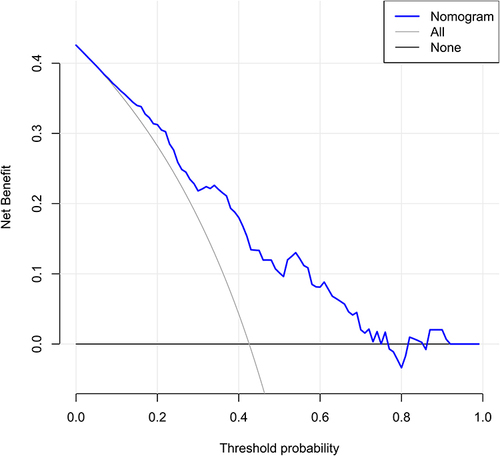
Figure 7 DCA of the nomogram to evaluate the clinical applicability of the model. The blue line represents the net benefit of the nomogram. It reveals that the nomogram yields clinical net benefit when the threshold probability is <0.8.