Figures & data
Figure 1 LPC (17:0) treatment alleviated glucose metabolism related disorders in HFD-fed mice. (A) Body weight, (B) 6h-fasted blood glucose, (C) HbA1c, (D) Plasma insulin, (E) HOMA-IR, (F) Plasma GLP-1, (G) OGTT and (H) AUC, (I) ITT and (J) AUC, (K) serum TG, (L) serum TC, (M) serum LDL-C, (N) serum HLD-C, (O) Representative H&E-stained pictures and distribution of adipocyte size in WAT deposits. Scale bars, 100 μm. Data are presented as the mean ± standard error of the mean (SEM); N = 7 mice per group. Statistical analysis was done using one way ANOVA followed by the Turkey post hoc test. #P < 0.05, ##P < 0.01, ###P < 0.001, compared with ND mice; *P < 0.05, **P < 0.01, ***P < 0.001 compared with HFD mice.
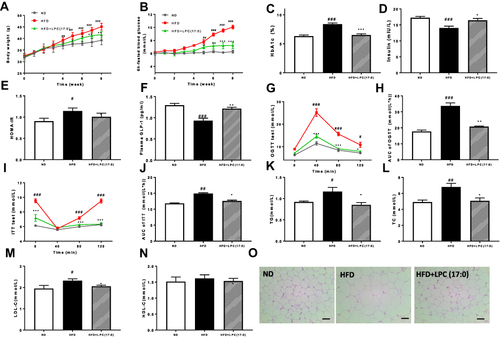
Table 1 Primers Used in the Study
Figure 2 Expression of GPCR mRNAs in LPC (17:0) treated mice. (A) Expression of Gpr119, Gpr40, Gpr55, Gpr120, Gpr43, Gpr41, Gpr35 in intestine tissue, (B) Expression of Gpr75, Gpr151, Gipr and Calcr in hypothalamus tissue. Statistical analysis was done using one way ANOVA followed by Tukey post hoc test. *P < 0.05 compared with HFD mice.
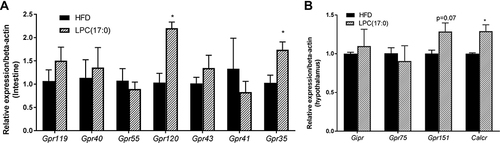
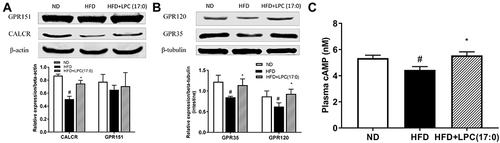
Figure 3 The expression of GPR120/GPR151 in intestine of mice treated with LPC (17:0) (A), and the expression of GPR35/CALCR in hypothalamus of mice treated with LPC (17:0) (B), Serum cAMP concentration (C). Statistical analysis was done using one way ANOVA followed by Tukey post hoc test. #P < 0.05 compared with ND mice; *P < 0.05 compared with HFD mice.