
Figures & data
Figure 1 Flow chart of participants in MS survey.
Notes: *Exclusion criteria: (1) taking vitamin D and calcium tablets in the past three months, (2) severe liver and kidney dysfunctions, cardiovascular and cerebrovascular diseases, hypothyroidism, and hyperthyroidism, (3) pregnancy, and (4) a history of severe diseases, such as malignant tumors.
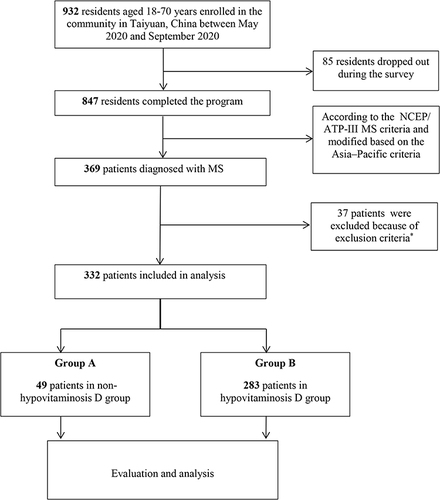
Figure 2 Echocardiographic perirenal fat thickness. The perirenal fat located between the surface of the kidney and the yellow curve. The perirenal fat thickness is marked by the red line.
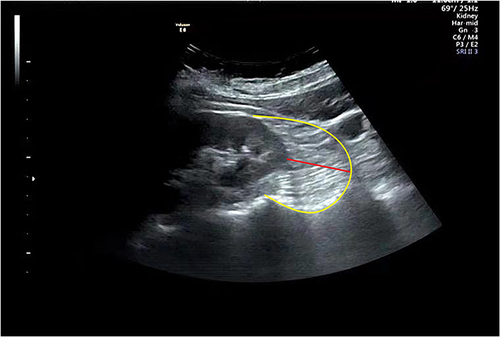
Table 1 General Characteristics of All Participants
Table 2 Correlation Analysis of 25(OH)D and Other Variables
Table 3 Multiple Stepwise Regression Between 25(OH)D and Related Variables