Figures & data
Table 1 Clinical Characteristics of All Participants
Figure 1 Comparison of coagulation indexes between low eGDR group and high eGDR group. (A) Comparison of the levels of PT between low eGDR group and high eGDR group. (B) Comparison of the levels of APTT between low eGDR group and high eGDR group. (C) Comparison of the levels of FIB between low eGDR group and high eGDR group.
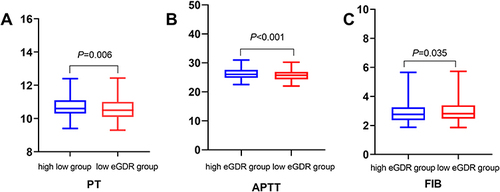
Table 2 Comparison of Indicators Between the Low eGDR and High eGDR Groups
Figure 2 Comparison of coagulation indexes between male group and female group. (A) Comparison of the levels of PT between male group and female group. (B) Comparison of the levels of APTT between male group and female group. (C) Comparison of the levels of FIB between male group and female group.
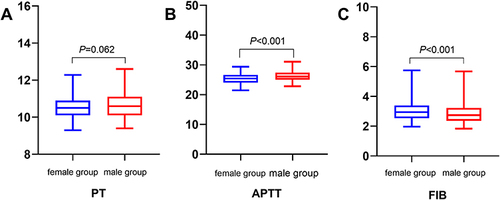
Table 3 Comparison of Indicators Between the Male and Female Groups
Table 4 The Correlation of eGDR and Coagulation Indexes in Patients with T2DM
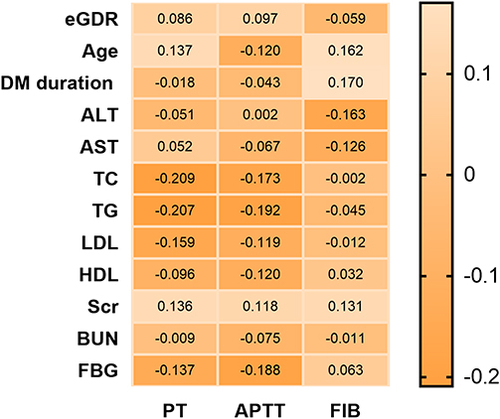
Figure 3 Spearman correlation coefficient matrix illustrating the association between coagulation indexes and baseline patient characteristics in all patients with T2DM.
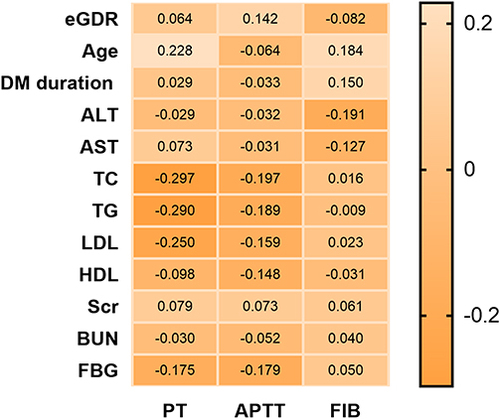
Figure 4 Spearman correlation coefficient matrix illustrating the association between coagulation indexes and baseline patient characteristics in male patients with T2DM.
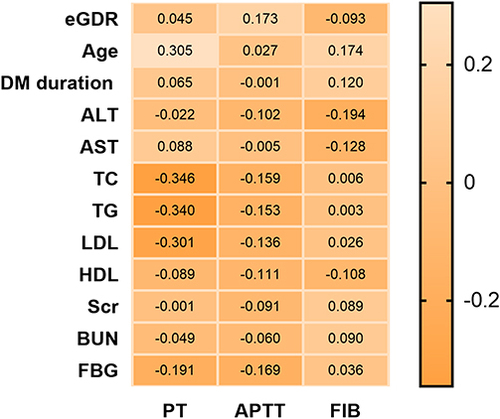
Figure 5 Spearman correlation coefficient matrix illustrating the association between coagulation indexes and baseline patient characteristics in female patients with T2DM.