Figures & data
Figure 1 Morphological, phenotypic characteristics, and various inducing differentiation capabilities of hAMSCs. (A) hAMSCs were fusiform, polygonal, and star-shaped. Immunocytochemical staining revealed that hAMSCs expressed vimentin, a mesenchymal cell marker. (B) The staining results; 21 days after differentiation of hAMSCs into osteoblasts, chondroblasts, and adipocytes.
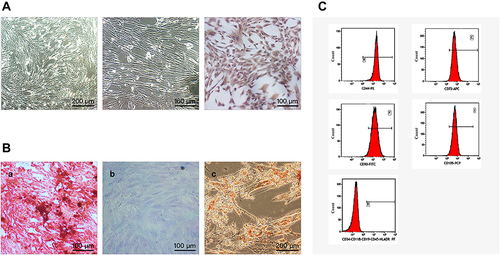
Figure 2 Image of hAMSCs homing in kidney tissue (×40 Green: MAB1281, blue: nucleus).
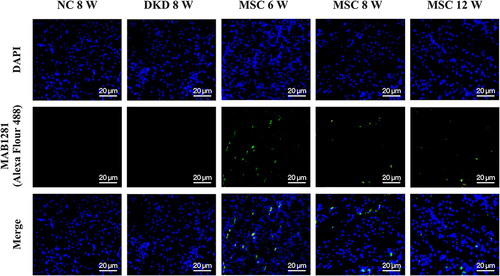
Table 1 Comparison of Blood Glucose and 24-h Urine Protein Levels Among Three Rat Groups
Table 2 Comparison of SCr and Urea Levels Among Three Rat Groups
Table 3 Comparison of Serum Cys-c and Urine KIM-1 Levels Among Three Rat Groups
Figure 3 Timetable and flowchart of rat treatment, as well as changes in blood and urine biochemical indicators after hAMSCs transplantation. (A) The flowchart of rat treatment from Day 0 to Week 12. (B–G) The histogram of blood glucose and 24-hour urine protein levels, and urea levels, Cys-c, and urine KIM-1 levels among three rat groups.
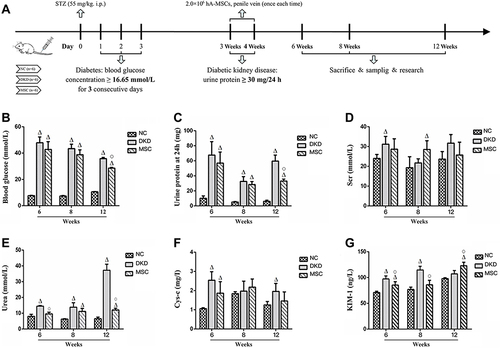
Table 4 Comparison of Kidney/Body Weight Among Three Rat Groups
Figure 4 The effect of hAMSCs transplantation intervention on STZ-induced kidney pathological changes in rats. (A) Kidney/body weight: the DKD and MSC groups had a higher kidney/body weight ratio than the NC group at each time point (P <0.05). The MSC group had a lower kidney/body weight ratio than the DKD group. However, statistical significance was observed at 6 and 12 weeks (P <0.05). (B) Renal tissue stained with H&E among three rat groups (×400): light blue arrow: inflammatory cell infiltration; dark blue arrow: renal tubule hypertrophy. (C) Renal tissue stained with PAS among three rat groups (×400): black arrow: increased mesangial matrix; red arrow: thickened tubular basement membrane.
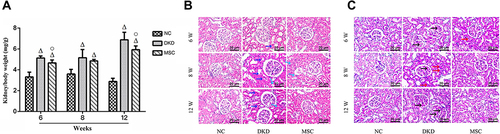
Figure 5 hAMSCs transplantation improved mRNA expressions of angiogenic factors in rat kidneys. TSP-1, VEGF, Tie-2, Ang-1, and Ang-2 mRNA expression levels in the NC, DKD, and MSC groups at each time point.
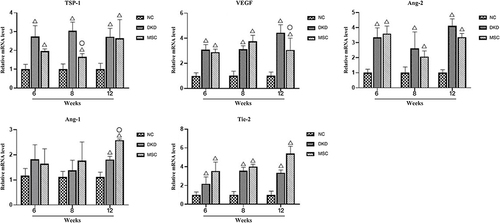
Figure 6 hAMSCs transplantation improved the protein expressions of angiogenic factors in rat kidneys. (A–C) The TSP-1, VEGF, Tie-2, and Ang-1 protein expression levels in the NC, DKD, and MSC groups at each time point.
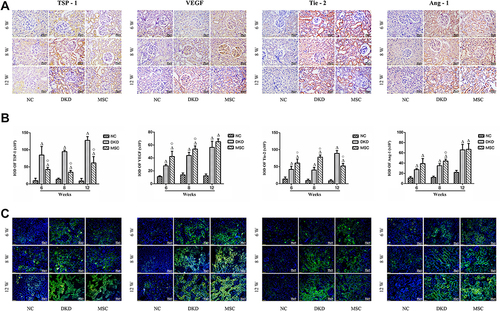
Figure 7 hAMSCs transplantation improved protein expressions of VEGF, Ang-1, and TSP-1 in T1DRM at 8 weeks (as determined by WB analysis) (A–D). Note: Compared with the NC group, ΔP < 0.05; Compared to group DKD, *P < 0.01.
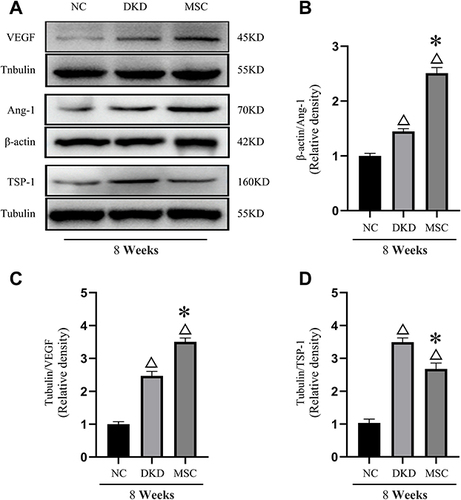
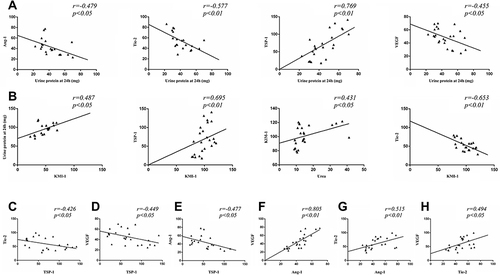
Figure 8 Correlation analysis results of various indicators. (A) Linear chart of correlation analysis between 24-hour urine protein and TSP-1, VEGF, Tie-2, and Ang-1. (B) Linear chart of correlation analysis between KIM-1 and 24-hour urine protein, TSP-1, Urea, and Tie-2. (C and D) Linear correlation analysis between TSP-1, Tie-2, and VEGF. (E and F) Linear correlation analysis between Ang-1, TSP-1, and VEGF. (G and H) Linear correlation analysis between Tie-2, Ang-1, and VEGF.