Figures & data
Table 1 Baseline Characteristics of the Study Participants
Table 2 The Isotope Glomerular Filtration Rate (iGFR) in T2D with or without Renal Cysts
Figure 1 The comparisons of age, duration, BMI, iGFR, eGFR, and Scr between T2D patients with or without renal cysts. The results showed significant differences in BMI (C), iGFR (D), and eGFR (E) between T2D patients with and without renal cysts (p<0.05). However, the differences in age (A), duration (B), and Scr (F) did not reach statistical significance.
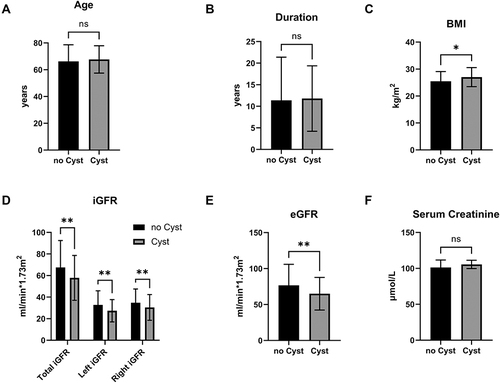
Figure 2 The heatmap depicts the correlation between cyst volume and other parameters. The correlation coefficient and the significance of critical parameters are shown as described in the text. The gradient in red represents the degree of positive correlation, while the gradient in blue represents the negative correlation, as shown by the color bar on the right side of the map.
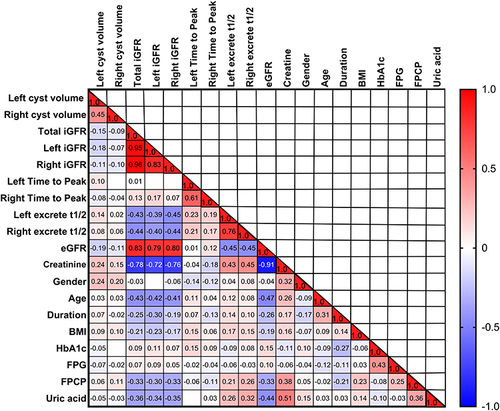
Table 3 A Multilinear Regression Model of Serum Creatinine Level (Represented as Log SCr) in Patients with Renal Cysts
Table 4 A Multilinear Regression Model of iGFR in Patients with Renal Cysts
Table 5 The Gender Disparity in General Characteristics, Renal Cyst Volume, Kidney Function, Glucose Metabolism, and Serum Creatinine Levels
Figure 3 Gender disparity in age (A), duration (B), BMI (C), cyst volume (D), iGFR (E), eGFR (F), serum creatinine (G), FPG (H), HbA1c (I), FPCP (J).
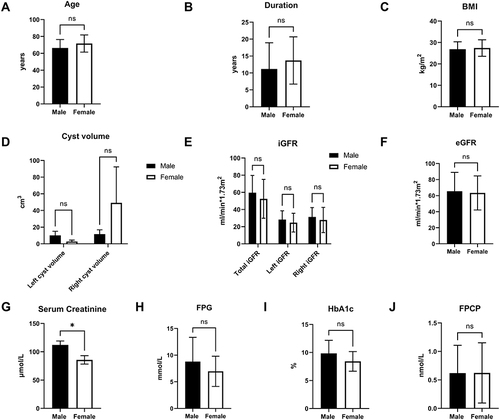
Table 6 The Split Kidney Function Reflected by iGFR and Related Parameters
Figure 4 Comparison of split kidney function based on iGFR (A), time to peak (B), 1/2 time of excretion (C) coexistence of renal cysts. The figure depicts distinction in iGFR (A), time-to-peak (B), 1/2 time of excretion (C) between the healthy kidney (without cysts) and diseased kidney (with cysts) of the same group (left kidney cysts or right kidney cysts); left iGFR, left TTP, left excrete 1/2 or right iGFR, right TTP, right excrete t1/2 between the different group (left kidney cysts or right kidney cysts).
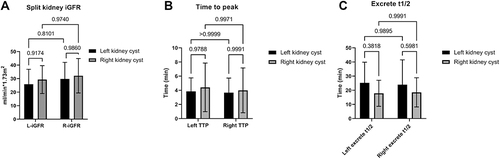
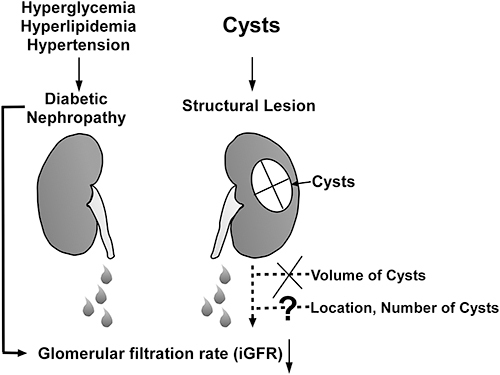
Figure 5 In T2DM patients, the reduced glomerular filtration rate (iGFR) may be caused by hyperglycemia, hypertension, and hyperlipidemia. The volume of renal cysts did not affect the unilateral kidney’s glomerular filtration rate. The remaining variables, such as cyst location and number, are unknown.