
Figures & data
Table 1 Baseline Patient Characteristics Based on sALB Tertiles
Figure 1 Relationships of sALB level with the prevalences of DR, DKD and macroalbuminuria. (A): Prevalences of DR, DKD and macroalbuminuria. Using the chi-square test. *P < 0.05 compared with Q1, #P < 0.05 compared with Q2. (B): sALB levels in patients with diabetes, with or without DR or DKD. Using the Kruskal–Wallis test, data are presented as medians with interquartile range. *P < 0.05 compared with G1, †P < 0.05 compared with G2, ‡P < 0.05 compared with G3.
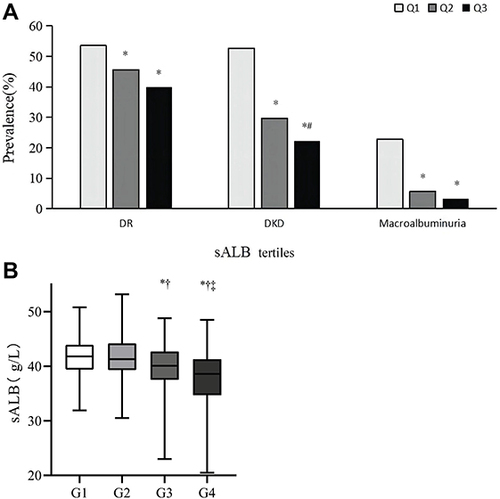
Table 2 Association Between sALB and Risk Factors Related to Microvascular Disease in Study Subjects
Table 3 Associations Between sALB Tertiles and Microvascular Disease in Study Subject
Table 4 Subgroup Analysis of Association Between sALB Tertiles and Microvascular Complication Stratified by Sex and Age