
Figures & data
Table 1 Demographic and Clinical Characteristics of Study Population
Figure 1 Increased adipose tissue associated CCL-2, IL-6 and IL-1β gene expression in OB group. (A-C) qRT-PCR analysis for CCL-2, IL-6 and IL-1β of omental adipose tissue from NOB and OB groups. (D-F) CCL-2, IL-6 and IL-1β gene expression are respectively positively associated with BMI and Ln(HOMA-IR).
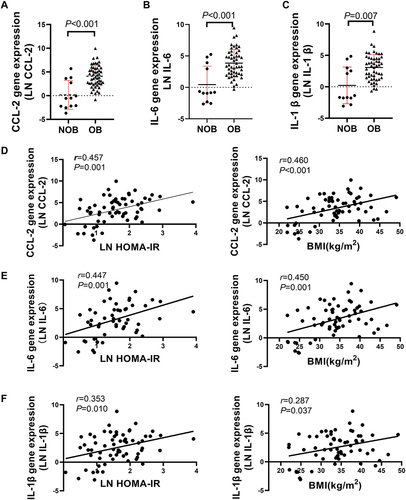
Table 2 Pearson’s Correlation Coefficients for CTSB and CTSL Gene Expression and Clinical Characters
Table 3 Relationship Between CTSB, CTSL Gene Expression in Omental Adipose Tissues and Adiposity
Figure 2 Increased CTSB and CTSL gene expression in omental adipose tissue of obese individuals. (A-B) qRT-PCR for CTSB and CTSL mRNA of omental adipose tissue from NOB and OB group. (C) In the study cohort, CTSL expression correlated positively with CTSB gene expression.
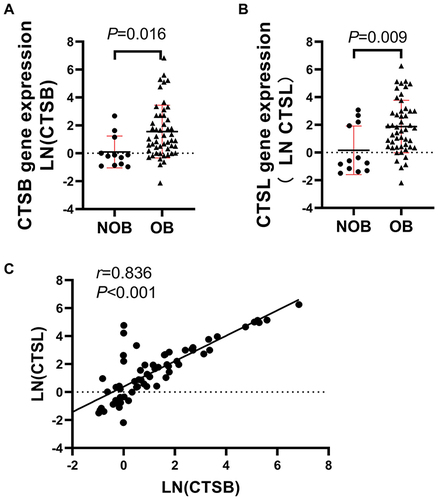
Table 4 Relationship Between Gene Expression Between CTSB/CTSL and Pro-Inflammatory Cytokines in Omental Adipose Tissues