Figures & data
Table 1 Clinical and Demographic Characteristics of CHB and CHB Concurrent NAFLD
Figure 1 Expression levels of ADAR1, miR-122 in livers of CHB concurrent NAFLD patients. (A) The mRNA and protein levels of ADAR1 in liver tissues, (B) The miR-122 level in liver tissues, (C) HE, Masson, and immunohistochemical staining of ADAR1 and HBeAg in liver tissues (magnification × 200). Bars represent the mean ± SD of triplicate repetitions. **P < 0.01.
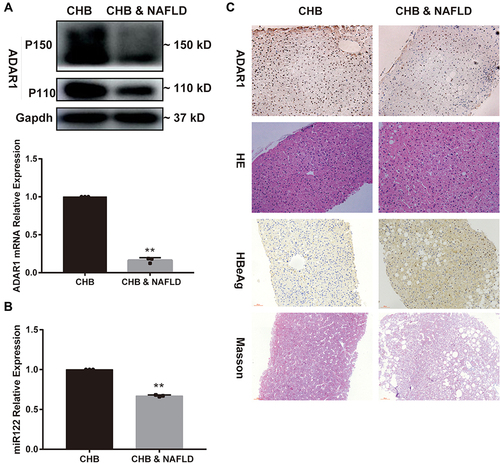
Figure 2 HBV related markers elevated in palmitic acid -treated HepG2.2.15 cells. (A–C) The most appropriate palmitic acid concentration in vitro was determined by detecting ALT, AST and cell viability and doing oil red O staining (magnification × 400). The concentrations of palmitic acid used are indicated below each picture. (D) Expression levels of HBV DNA and HBeAg in cells treated with different palmitic acid concentrations. Bars represent the mean ± SD of triplicate repetitions. *P < 0.05, **P < 0.01.
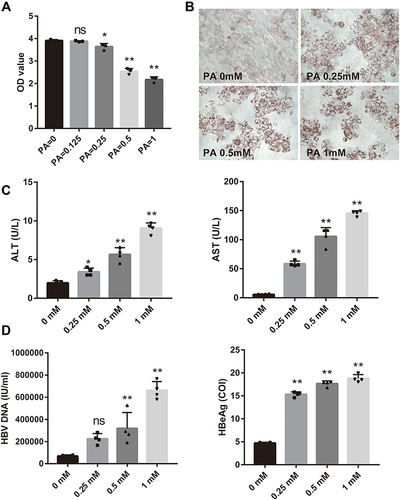
Figure 3 ADAR1 is downregulated in palmitic acid -treated HepG2.2.15 cells. (A) The mRNA and protein levels of ADAR1 in the control group and palmitic acid group. (B) After 24 h of palmitic acid treatment, cells were stained with antibody ADAR1 and fluorescent labeled Nile red, and then observed under a fluorescence microscope. (Scale bar: 25μm) *P < 0.05.
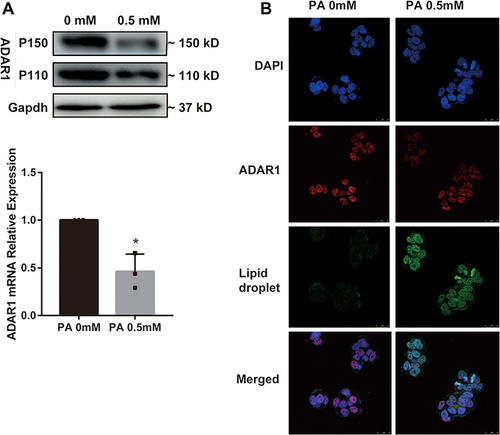
Figure 4 miR-122 inhibits HBV replication levels in palmitic acid -treated HepG2.2.15 cells. (A) qRT-PCR analysis of the expression of miR-122 in palmitic acid -treated HepG2.2.15 cells exposed to miR-122 mimic/inhibitor or negative control (NC). (B and C) After 48 h of miR-122 mimic/inhibitor or NC transfection, then 24 h of palmitic acid treatment, expression of HBV DNA and HBeAg levels in cell supernatant. Bars represent the mean ± SD of triplicate repetitions. *P < 0.05, **P < 0.01.
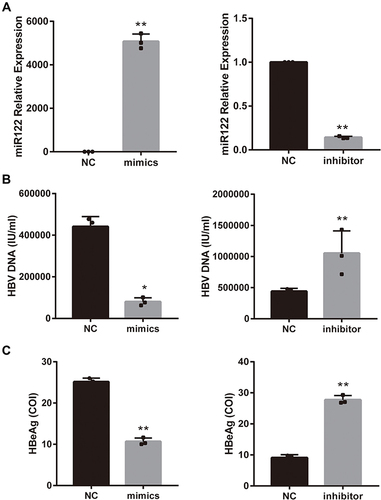
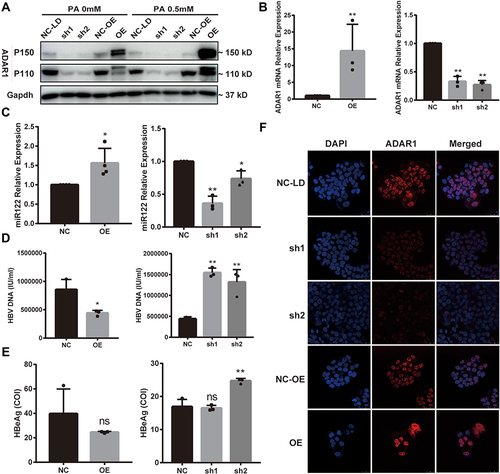
Figure 5 ADAR1 downregulates HBV DNA levels and increases miR-122 expression. HepG2.2.15 cells were transfected with GFP-ADAR1 lentivirus (OE) and ADAR1-shRNA lentivirus (LD) or the negative control (NC) and then treated with palmitic acid for 24 h. (A and B) mRNA and protein expression levels of ADAR1. (C) qRT-PCR analysis of miR-122 levels. (D–E) Expression levels of HBV DNA and HBeAg. (F) Cell localization and expression of ADAR1 were observed by immunofluorescence. (Scale bar: 25μm) All datas’ bars represent the mean ± SD of triplicate repetitions. *P < 0.05, **P < 0.01.