Figures & data
Table 1 Serum Glucose, Insulin, C-Peptide and ICPR Values in OGTTs Between the Two Groups (Median (Interquartile Range))
Figure 1 Changing trends of serum glucose, insulin, C-peptide levels, and ICPR values in OGTTs between the IA+ group and IA- group in T2DM patients.
Notes: (A) serum glucose levels; (B) serum insulin levels. (C) serum C-peptide levels. (D) ICPR, the insulin to C-peptide molar ratio. Data are presented as median (interquartile range).
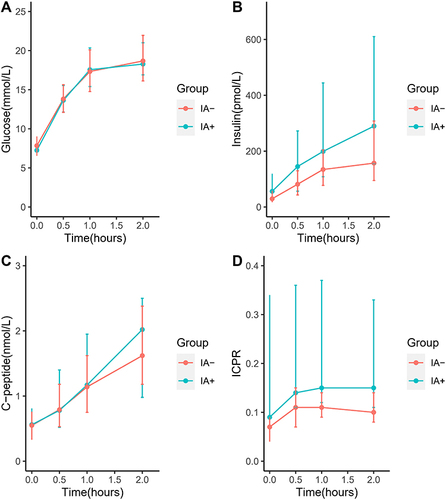
Table 2 Correlation Analysis of ICPR, HOMA-IR, and IAs
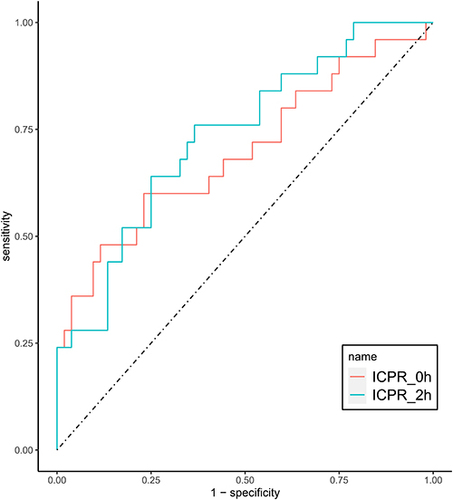
Table 3 ROC Analysis of ICPR-0h, ICPR-2h for Predicting the Presence of IAs
Figure 2 ROC curves of ICPR-0h and ICPR-2h for the predictive value of IA.