Figures & data
Table 1 Demographic and clinical characteristics, overall and by average pain severity
Figure 1 Comorbidities among pDPN subjects, by average pain severity.*
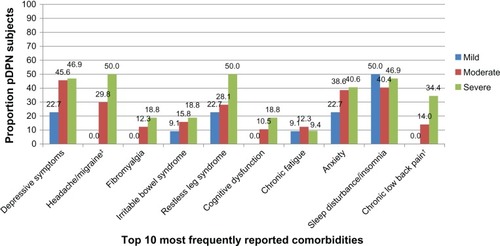
Table 2 Subject-reported outcomes, overall and by average pain severity
Figure 2A SF-12 physical and mental component summary scores, overall and by average pain severity.*
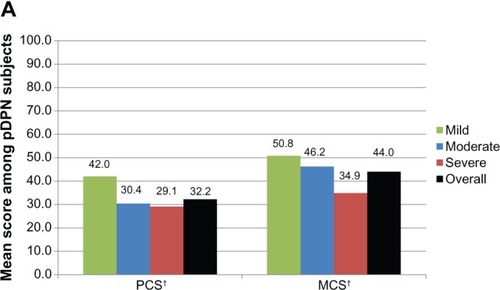
Figure 2B Pain interference with function, overall and by average pain severity.*
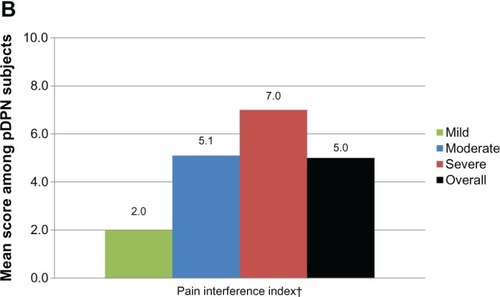
Figure 2C MOS-SS overall sleep index, overall and by average pain severity.*
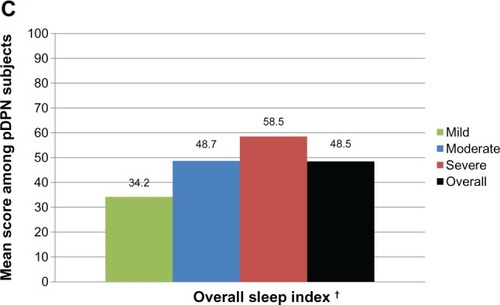
Figure 3A Proportion of pDPN subjects taking prescription medications for pDPN, overall and by average pain severity.*
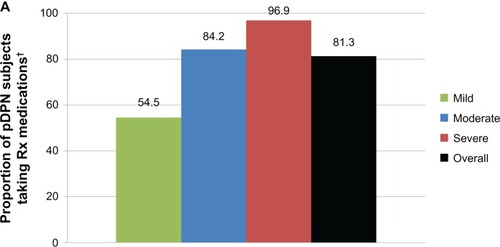
Figure 3B Use of prescription treatments for pDPN, overall.*
Abbreviations: AEDs, antiepileptics; SAO, strong-acting opioids; NSAIDs, nonsteroidal anti-inflammatory drugs; LAO, long-acting opioids; SNRIs, Serotonin–norepinephrine reuptake inhibitors; TCAs, tricyclic antidepressants; SSRI, selective serotonin re-uptake inhibitors.
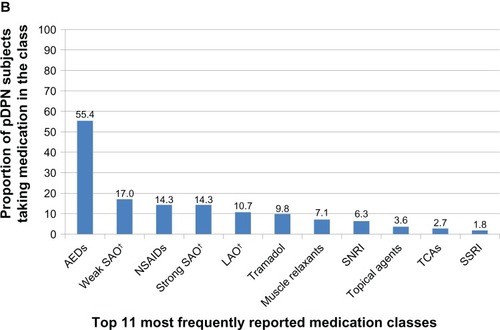
Table 3 Resource utilization for painful diabetic peripheral neuropathy, overall and by average pain severity
Table 4 Subject-reported nonprescription medications used to treat painful diabetic peripheral neuropathy, overall and by average pain severity
Table 5 Work productivity and activity impairment: pDPN (WPAI:pDPN), overall and by average pain severity
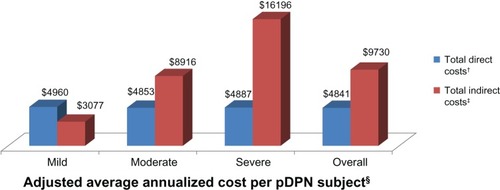
Figure 4 Adjusted average annualized cost per pDPN subject, overall and by average pain severity.*