
Figures & data
Table 1 Sociodemographic and Obstetric Histories of Patients with HDP
Table 2 Sociodemographic and Obstetric Histories of Patients with HDP-GDM
Figure 1 Total incidence and subsets incidence of HDP. The total number of women delivered in the research center was 6166 in 2020, 7268 in 2019, and 7153 in 2018. After screening the electronic medical records according to the above inclusion and exclusion criteria, 6024 women were excluded in 2020, 7194 in 2019, and 7093 in 2018. Finally, a total of 276 HDP patients were used for subsequent analysis, including 142 HDP patients in 2020, 74 in 2019, and 60 in 2018. Additionally, a total of 197 women with HDP-GDM were included in our cohort, including 105 women in 2020, 52 women in 2019, and 40 in 2018. As for women with GH, there was 100 women in 2020, 32 women in 2018 and 34 women in 2019. Lastly, 42 women with PE/E in 2020 were enrolled in our cohort, 28 women in 2018 and 40 women in 2019.
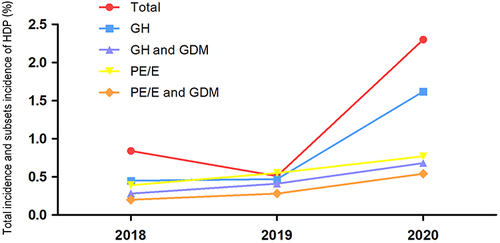
Table 3 Pregnant Outcomes of HDP Patients
Table 4 Pregnant Outcomes of HDP with GDM Patients