Figures & data
Table 1 Laser Parameters
Table 2 Cell Migration Rate (%) in Normal Wounded (NW), Diabetic Wounded (DW) and Hypoxic Diabetic Wounded (HDW) Cells After Irradiation at 830 Nm with 5 J/cm2 at 24, 48, and 72 h Compared with Their Corresponding Non‐irradiated (0 J/cm2) Wounded Models
Figure 1 (A) Normal wounded (NW), (B) Diabetic wounded (DW) and (C) Hypoxic diabetic wounded (HDW) WS1 fibroblast cells at 0, 24, 48, and 72 h post‐irradiation at 830 nm with 5 J/cm2 (magnification 200x, scale bar = 200 µm), non-irradiated (0 J/cm2) cells served as controls.
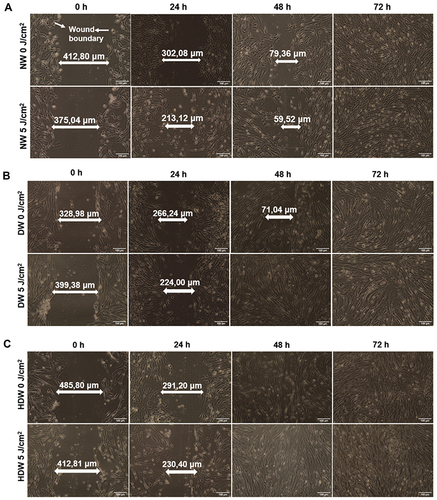
Figure 2 Cellular viability as evaluated by the CellTiter-Glo luminescent cell viability assay (ATP luminescence measured in relative light units, RLU).
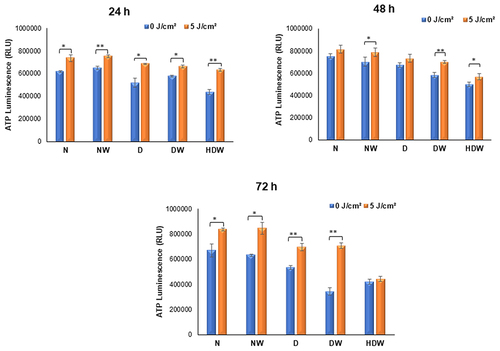
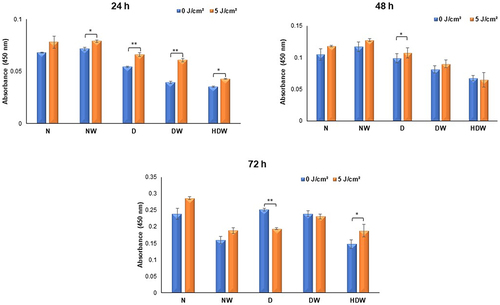
Figure 3 Cellular viability as assessed by the ApoTox-Glo triplex assay in WS1 cells.
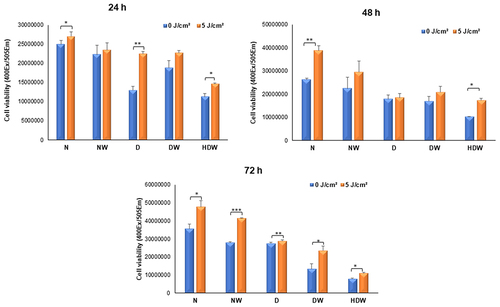
Figure 4 Cell cytotoxicity as assessed by the ApoTox-Glo triplex assay in WS1 cells.
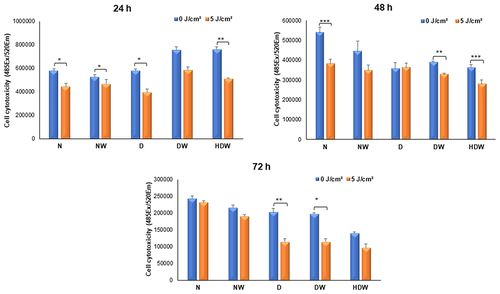
Figure 5 Caspase 3/7 activation as assessed by the ApoTox-Glo triplex assay in WS1 cells (expressed in RLU).
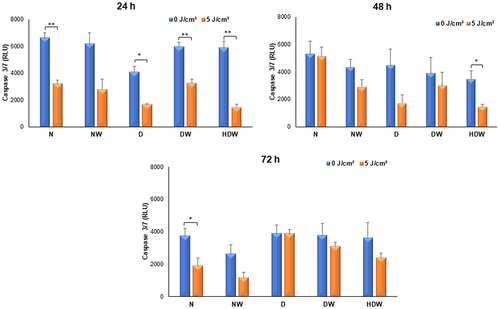
Table 3 Cell Proliferation Was Determined by Flow Cytometry (% Cells in S, G0/G1 and G2/M Phase) in Non-Irradiated (0 J/cm2) and Irradiated (5 J/cm2) Normal (N), Normal Wounded (NW), Diabetic (D), Diabetic Wounded (DW) and Hypoxic Diabetic Wounded (HDW) Cells 24, 48 and 72 h Post-Irradiation at 830 Nm
Figure 6 Presence of TGF-β1 in culture media measured using ELISA in irradiated (5 J/cm2) and non-irradiated (0 J/cm2) normal (N), normal wounded (NW), diabetic (D), diabetic wounded (DW) and hypoxic diabetic wounded (HDW) cells and analyzed 24, 48 and 72 h post-irradiation (830 nm).
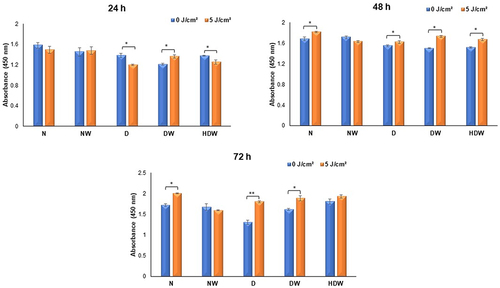
Figure 7 Presence of pTGF-βR1 measured using ELISA in irradiated (5 J/cm2) and non-irradiated (0 J/cm2) normal (N), normal wounded (NW), diabetic (D), diabetic wounded (DW) and hypoxic diabetic wounded (HDW) cells and analyzed 24, 48 and 72 h post-irradiation (830 nm).
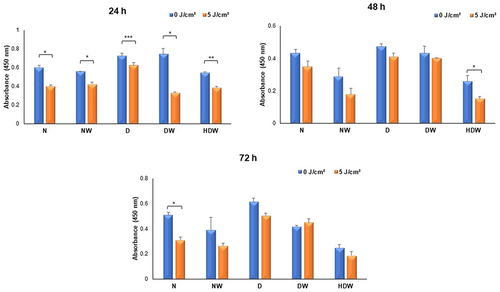
Figure 8 Presence of p-Smad2/3 measured using ELISA in irradiated (5 J/cm2) and non-irradiated (0 J/cm2) normal (N), normal wounded (NW), diabetic (D), diabetic wounded (DW) and hypoxic diabetic wounded (HDW) cells and analyzed 24, 48 and 72 h post-irradiation (830 nm).