Figures & data
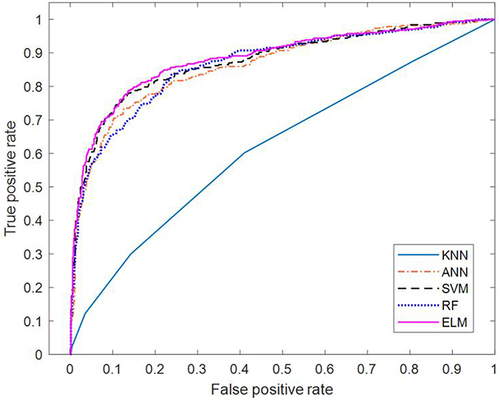
Figure 1 Data screening flow chart.
Notes: Patients with missing data: Delete samples with one or more missing variables; fundus examination: if there is any characteristic lesion, it is diagnosed as DR: microaneurysm, hemorrhage, cotton wool spot, abnormal microvascular in retina, hard exudate, venous hemorrhage, neovascularization.
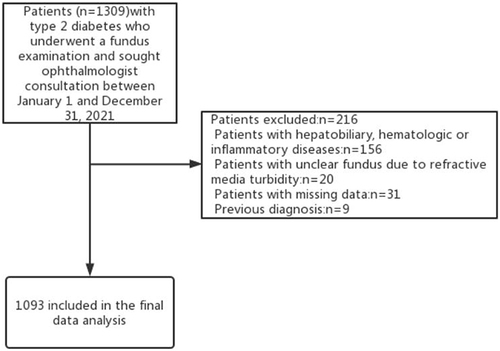
Table 1 DR Dataset
Figure 2 Basic principles of extreme learning machine (ELM).
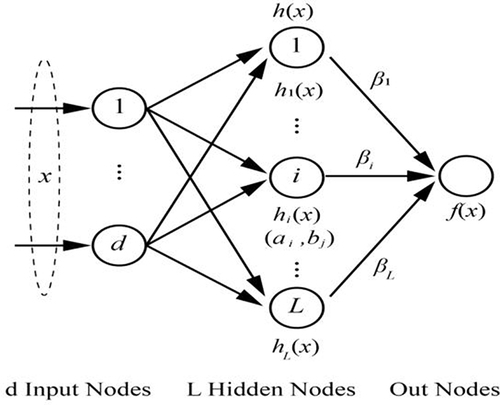
Figure 3 The Flow chart of prediction model.
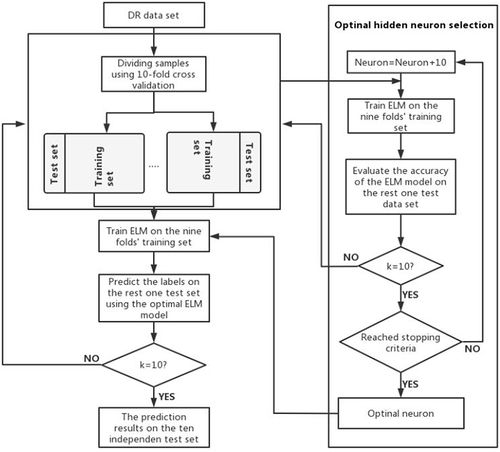
Figure 4 An association between classification accuracy (ACC) and number of distinct hidden neurons in the ELM (database of our hospital).
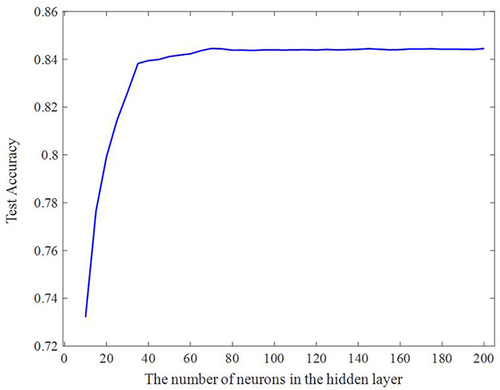
Table 2 The Extreme Learning Model (ELM) Model Produced Detailed Findings
Table 3 Extreme Learning Machine, Support Vector Machine, Artificial Neural Network, Random Forest, and k-Nearest Neighbor (ELM, SVM, ANN, RF, and KNN, Respectively) Classification Performances Were Compared
Figure 5 Receiver operating characteristic (ROC) curves corresponding to each model(database of our hospital).