Figures & data
Figure 1 Glucose, insulin, echocardiography and left ventricular catheterization findings in control and DM hearts. (A–D): IPGTT, IPITT, fasting serum insulin, and insulin resistance index results in control and DM rats at each time point. Data are shown as t-test results for the AUC of the glucose curve for 8 rats in each group. (E): Representative images of mitral flow Doppler and tissue Doppler in control and DM rats at 26 w. (F–H): E/A, E’/A’, and E/E’ ratio in control and DM rats at each time point. Data are shown as t-test results for 8 rats in each group. (I–K): dp/dt and LVEDP in control and DM rats at 26 w. Data are shown as t-test results for 3 rats in each group. *p<0.05 vs control; **p<0.01 vs control.
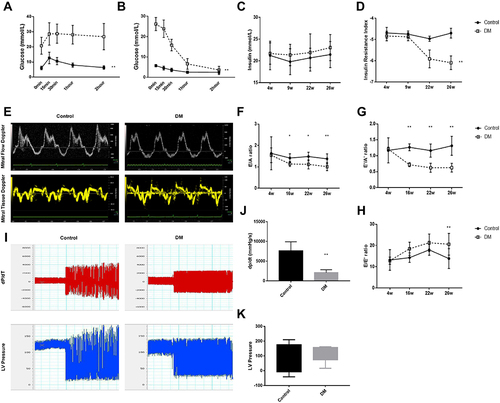
Figure 2 Cardiac fibrosis in control and DM hearts. (A): General view of control and DM hearts; (B and C): HE and WGA staining in control and DM hearts. The cell cross-sectional area in 8 rats in each group was compared using t tests. (D): Collagen I and collagen III immunohistochemistry and Masson staining of control and DM hearts; the data for 8 rats in each group were compared using t tests. **p<0.01 vs control.
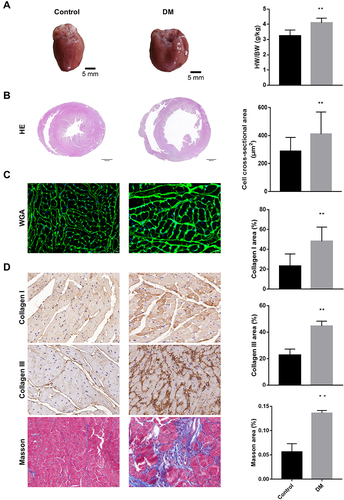
Figure 3 Representative Western blot and Western blot analysis of STAMP2 expression in the control, DM, vehicle and STMAP2 groups. Data for 6 rats in each group were compared using t tests. **p<0.01 vs vehicle; #p<0.05 vs DM.
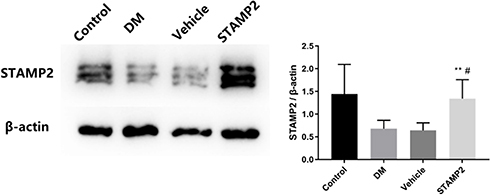
Figure 4 STAMP2 improved glucose tolerance and insulin sensitivity. (A-B): IPGTTs and IPITTs in rats from the control, DM, vehicle and STAMP2 groups at each time point. Data are shown as t-test results for the AUC of the glucose curve for 8 rats in each group. (C): Fasting serum insulin and insulin resistance index values in rats from the control, DM, vehicle and STAMP2 groups at each time point. Data for 8 rats in each group were compared using t tests. (D): Representative Western blot and Western blot analysis of Akt, p-Akt and IRS-1 expression in the control, DM, vehicle and STMAP2 groups. Data for 6 rats in each group were compared using t-tests. *p<0.05 vs vehicle, **p<0.01 vs vehicle, #p<0.05 vs DM, ##p<0.01 vs DM.
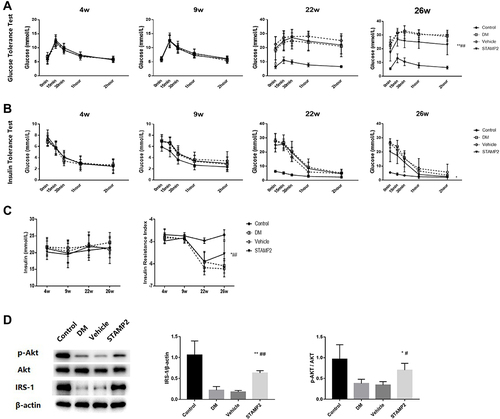
Figure 5 STAMP2 alleviated myocardial fibrosis in diabetic hearts. (A): General view of rat hearts from the control, DM, vehicle and STAMP2 groups; (B and C): HE and WGA staining of control, DM, vehicle and STAMP2 group hearts. The cell cross-sectional area in 8 rats from each group was compared using t tests. (D): Collagen I and collagen III immunohistochemistry and Masson staining in hearts from rats in the control, DM, vehicle and STAMP2 groups. Data for 8 rats in each group were compared using t tests. *p<0.05 vs vehicle, **p<0.01 vs vehicle, #p<0.05 vs DM, ##p<0.01 vs DM, $$p<0.01 vs control.
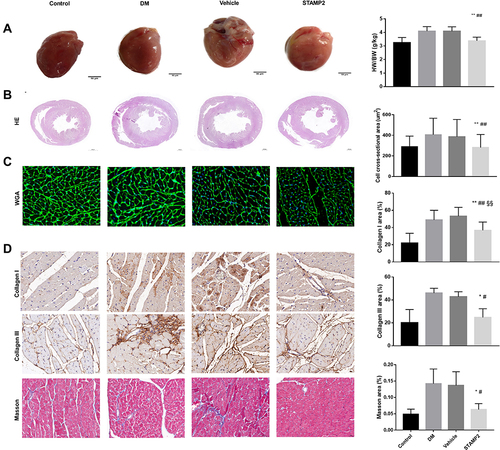
Figure 6 STAMP2 attenuates diabetes-induced diastolic dysfunction. (A): Representative mitral flow Doppler, tissue Doppler, dP/dT and LV pressure results for rats in the control, DM, vehicle and STAMP2 groups; 6 samples from each group were used for the study. (B): Analysis of the E/A, E’/A’, and E/E’ ratios; EF; dp/dt; and LVEDP in control, DM, vehicle and STAMP2 rats. The data are shown as t-test results for each group. *p<0.05 vs vehicle, **p<0.01 vs vehicle, #p<0.05 vs DM, ##p<0.01 vs DM.
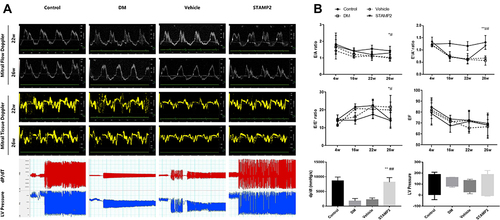
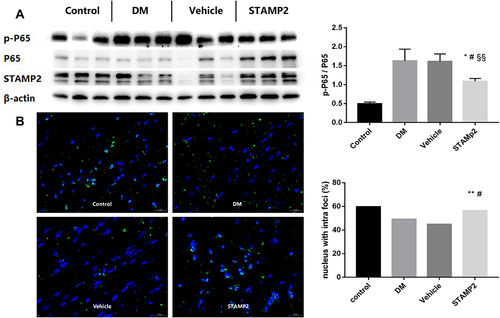
Figure 7 STAMP2 induces NMRAL1 translocation to the nucleus and negatively regulates NF-κB signaling. (A): Western blot analysis of p-p65, p65 and STAMP2 expression in the control, DM, vehicle and STMAP2 groups. Data for 6 rats in each group were compared using t tests. (B): Representative immunofluorescence of NMRAL1 showing the intra- and extranuclear distribution and ratio of nuclei with NMRAL1 imbedded to total nuclei in the control, DM, vehicle and STMAP2 groups. Data for 8 rats in each group were compared using χ²-tests. *p<0.05 vs vehicle, **p<0.01 vs vehicle, #p<0.05 vs DM, $$p<0.01 vs control.