Figures & data
Figure 1 Flow chart of the experiment.
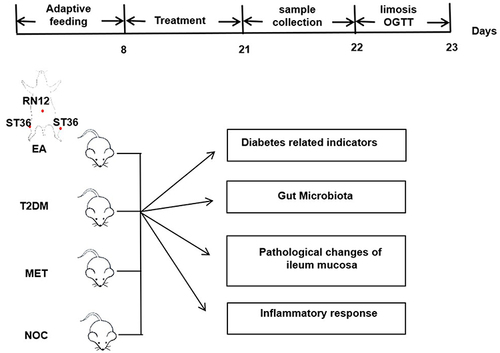
Figure 2 General indicators of diabetes in each group. (A) Food intake. (B) Water intake. (C) Body weight. (D) FBG levels. (E) OGTT. And (F) AUC. Data are shown as the mean ± SD values. *P < 0.05, **P < 0.01 (n = 8).
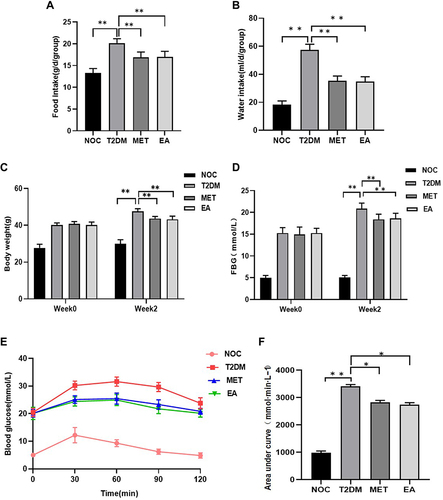
Figure 3 Related indicators of diabetes mellitus in each group. (A) FINS. (B) HOMA-IR. (C) TC levels. (D) TG levels. (E) HDL-C levels. (F) LDL-C levels. Data are shown as the mean ± SD values. *P < 0.05, **P < 0.01 (n = 8).
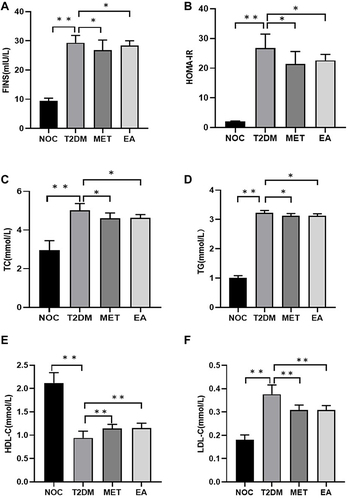
Figure 4 Diversity of fecal microbiota between groups (phylum level). (A) PCA. (B) Circos. (C) Stacked bar chart. (D) Bar plot difference analysis. (E) Bacteroidetes. (F) Firmicutes. (G) Firmicutes/Bacteroidetes. Data are shown as the mean ± SD values. *P < 0.05 (n = 4).
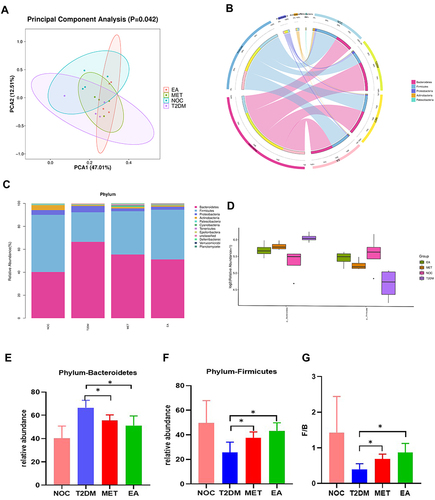
Figure 5 Differences in the composition of the gut microbiota at the genus level among each group. (A) Stacked bar chart. (B) Eubacterium. Data are shown as the mean ± SD values, **P < 0.01 (n = 4).
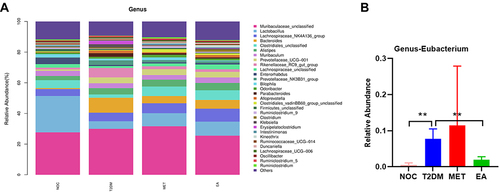
Figure 6 Pathological images of the ileum and serum inflammatory factors in each group. (A) H&E staining (n=4). Serum LPS (B) and TNF-α (C) levels were detected with ELISA kits. Data are shown as the mean ± SEM. **p < 0.01 (n = 8).
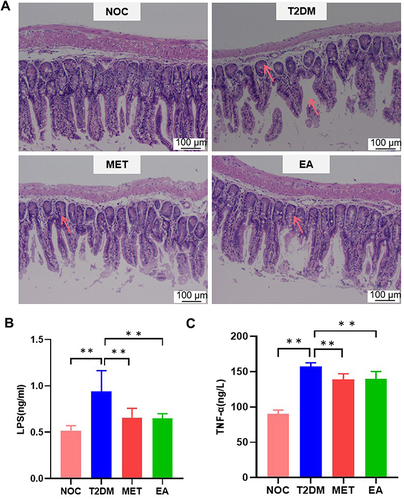
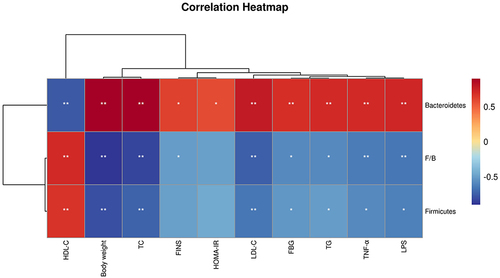
Figure 7 The correlation analysis matrix between related factors and intestinal flora changes in T2DM mice was based on the Pearson correlation value. *P < 0.05, **P < 0.01 indicates significant correlation.