Figures & data
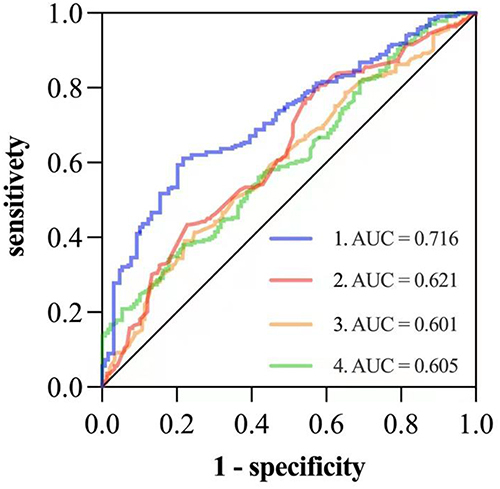
Figure 1 Flow chart of study participant enrollment.
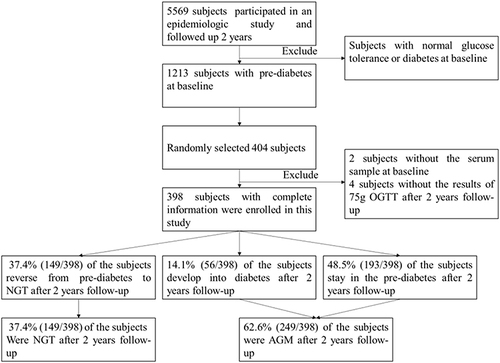
Table 1 Clinical Parameters of Participants with Normal Glucose Tolerance and Abnormal Glucose Metabolism at Baseline and the 2-Year Follow-Up
Table 2 Correlations Between FABP4 Levels and the Clinical Parameters of Participants at the End of the Follow-Up Period
Table 3 The Baseline Variables That Predict Reversion from Prediabetes to Normal Glucose Tolerance
Table 4 Cut off Value of FBG, 2hBG and FABP4 in Predict Reversion from Prediabetes to Normal Glucose Tolerance
Figure 2 Receiver operating characteristic (ROC) curves of baseline FBG (Line 2), baseline 2hPG (Line 3), baseline FABP4 (Line 4), and a combination of the three (Line 1) for predicting reversion from prediabetes to normal glucose tolerance.