Figures & data
Table 1 Identification of Com Components of TPS Extract by UPLC-OE-MS Analysis
Figure 1 UPLC-OE-MS Analysis base peak intensity chromatograms of TPS extract in positive mode.
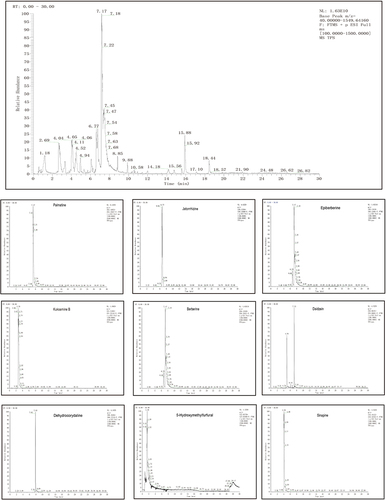
Figure 2 UPLC-OE-MS Analysis base peak intensity chromatograms of TPS extract in negative mode.
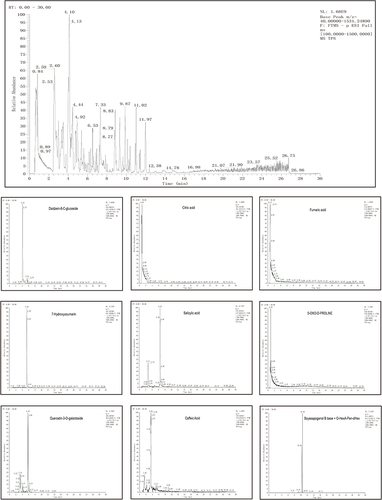
Figure 3 Effects of TPS on weight, glucose homeostasis in T2DM mice. (A)TPS treatment improves weight loss in T2DM mice; (B-D) Levels of FINS FBG and HOMA-IR after TPS treatment; (E and F) The AUC of OGTT was decreased in T2DM mice after TPS treatment; (G) TPS treatment increased hepatic glycogen content in T2DM mice. Control, Model, TPS-L, TPS-M and TPS-H (n = 6 per group) groups. Data are presented as the mean ± SD. **P < 0.01.
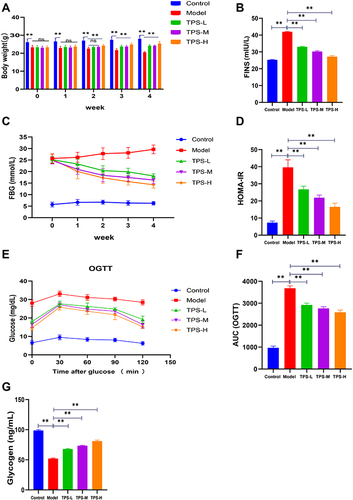
Figure 4 (A) Pathological changes of pancreas of mice in each group by HE staining (50μm). Effects of TPS on dyslipidemia and liver function in T2DM mice: (B-E) Changes in blood lipid levels after TPS treatment; (F-G) Changes in serum AST, ALT activities after TPS treatment; (H) Pathological changes of liver of mice in each group by HE staining (50μm); (I) Pathological changes of liver of mice in each group by oil red O dyeing (50μm). Control, Model, TPS-L, TPS-M and TPS-H (n = 6 per group) groups. Data are presented as the mean ± SD. **P < 0.01.
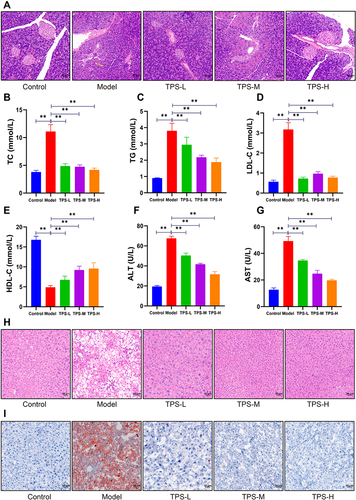
Figure 5 Effects of TPS on inflammatory factors in T2DM Mice. (A-C) TPS treatment decreased the levels of pro-inflammatory cytokines in serum; (D and E) TPS treatment reduced serum levels of anti-inflammatory cytokines; (F) TPS treatment reduced the level of LPS in serum; (G-J) Levels of tight junction proteins ZO-1, OCLN and Claudin1; (K) Pathological changes of colon of mice in each group by HE staining (50μm). Control, Model, TPS-L, TPS-M and TPS-H (n = 6 per group) groups. Data are presented as the mean ± SD. *P < 0.05 and **P < 0.01.
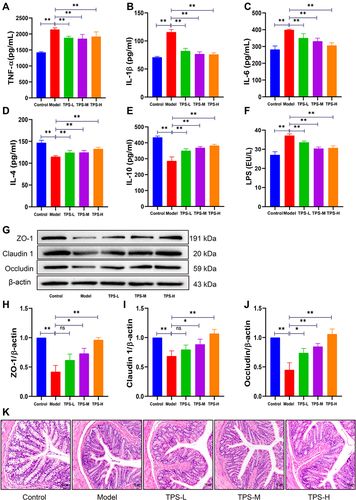
Table 2 Beta Diversity Profiling
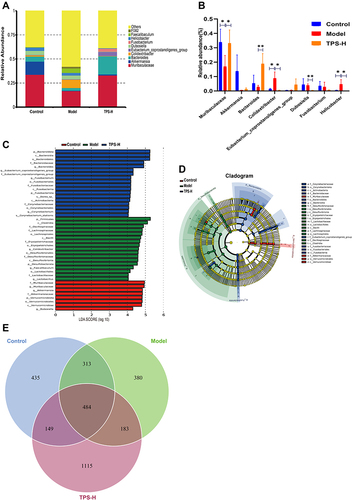
Figure 6 TPS treatment affected the gut microbiota community in T2DM mice. (A) PCoA indicated more similar beta diversity between TPS high-dose and Control groups than that between the Model and Control groups; (B) At the phylum level, differences in species abundance between groups; (C and D) Shannon and Simpson indexes were lower in TPS high-dose group than that in the Model group; (E) At the phylum level, TPS treatment decreased the F to B ratio in T2DM mice; (F) At the Phlylum level cluster analysis changes in a heatmap.The relative abundances of 30 dominant genera in the gut microbiota of four groups are presented in a heatmap; (G) Percent of community abundance on phylum level. Control, Model and TPS-H (n = 4 per group) groups. Data are presented as the mean ± SD. *P < 0.05.
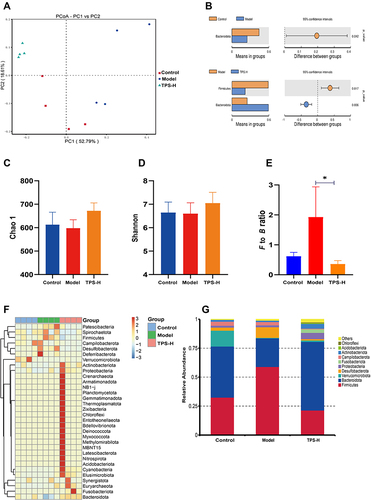
Figure 7 TPS treatment affected the gut microbiota community in T2DM mice. (A)Percent of community abundance on genus level; (B) At the genus level, TPS treatment affected the relative abundances of Akkermansia, Muribaculaceae, Bacteroides, Colidextribacter, Eubacterium_coprostanoligenes_group, Dubosiella, Fusobacterium, Helicobacter in T2DM mice; (C and D) LEfSe analysis of species abundance differences among multiple groups; (E)The Venn diagram depicted OTUs that differed in each group. Control, Model and TPS-H (n = 4 per group) groups. Data are presented as the mean ± SD. *P < 0.05 and **P < 0.01.