Figures & data
Figure 1 Group 1, the HbA1c<7% group (n=76, with blood glucose at target). Group 2, the 7% ≤ HbA1c < 9% group (n=123). Group 3, the HbA1c ≥ 9% group (n=186, with poorly glycemic control). There was not a significant difference in CEA level between group 1 and group 2, p = 0.463. There was a significant difference in CEA level between group 2 and group 3, p = 0.000. p value less than 0.01 was considered statistically significant.
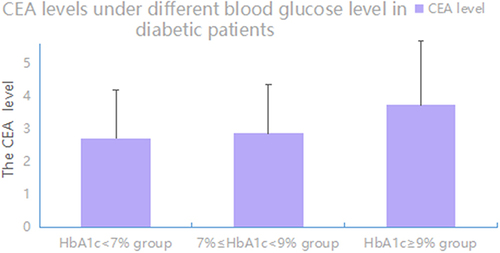
Table 1 Basic Demographic, Clinical Characteristics and CEA Levels of Participants
Table 2 Correlation Analysis of CEA Level in Diabetic Inpatients
Figure 2 Group 1 (n= 143), BMI<24 kg/m2. Group 2, the overweight group (n= 173), BMI ≥24 kg/m2 and < 28 kg/m2. Group 3, the obesity group (n= 69), BMI ≥ 28 kg/m2. There was a significant difference in CEA level between group 1 and group 2, p = 0.000. There was not a significant difference in CEA level between group 2 and group 3, p = 0.296. There was a significant difference in CEA level between group 1 and group 3, p = 0.017. p value less than 0.05 was considered statistically significant.
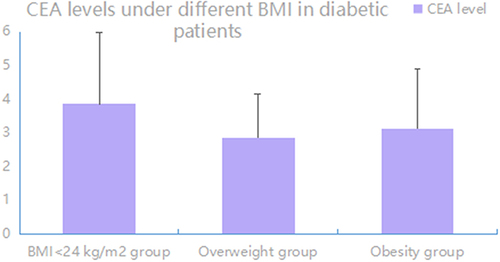
Figure 3 The elevated CEA group (n=42), the CEA level ≥ 5ng/mL; the non-elevated CEA group (n=267), the CEA level < 5ng/mL. There was a significant difference in the insulin level between the elevated CEA group and the non-elevated CEA group. *p value was less than 0.05.
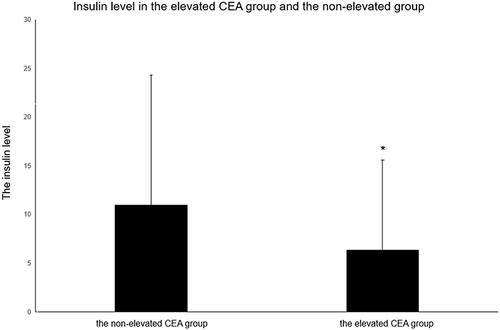
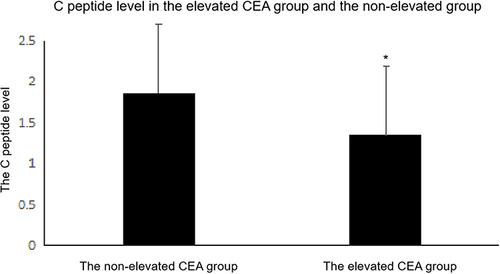
Figure 4 The elevated CEA group (n=42), the CEA level ≥ 5ng/mL; the non-elevated CEA group (n=267), the CEA level < 5ng/mL. There was a significant difference in the C peptide level between the elevated CEA group and the non-elevated CEA group. *p value was less than 0.05.