Figures & data
Table 1 Characteristics of Male Patients with T2DM (n = 186)
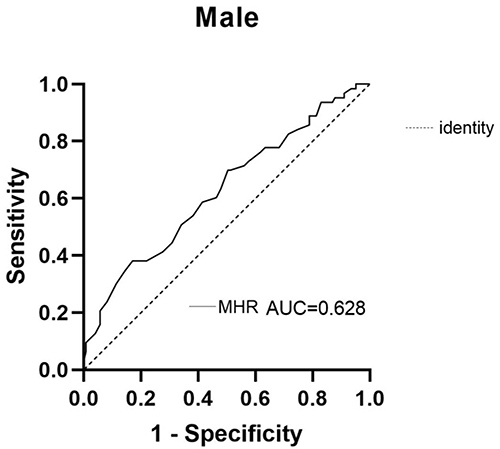
Figure 1 Comparisons of age and MHR in groups A1 and A2. (A) Age comparisons; (B) MHR comparisons. *P < 0.05.
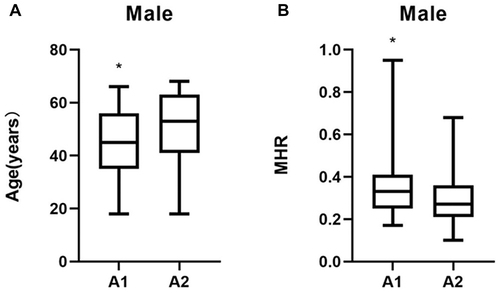
Figure 2 Comparisons of LC, GFR, TG, and HDL in groups A1 and A2. (A) LC comparisons; (B) GFR comparisons; (C) TG comparisons; and (D) HDL comparisons. *P < 0.05.
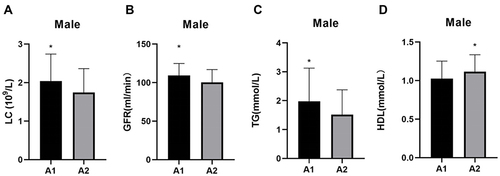
Table 2 Characteristics of Female Patients with T2DM (n = 74)
Figure 3 MHR comparisons in groups B1 and B2. *P < 0.05.
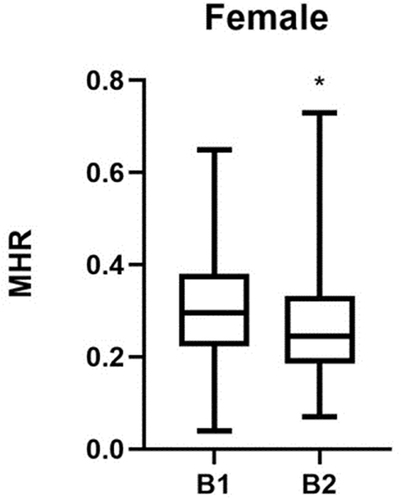
Figure 4 Comparisons of SUA, TG, and HDL in groups B1 and B2. (A) SUA comparisons; (B) TG comparisons; and (C) HDL comparisons. *P < 0.05.
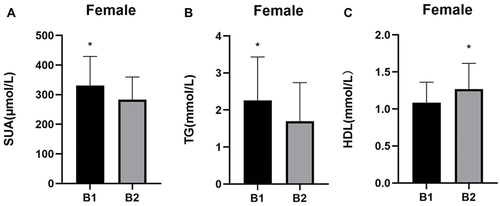
Table 3 Correlation Between Other Factors and Vitamin D Level in Male Patients with T2DM
Table 4 Correlation Between Other Factors and Vitamin D Level in Female Patients with T2DM
Table 5 Association Between Vitamin D Levels and MHR in Male Patients with T2DM
Table 6 Association Between Vitamin D Levels and MHR in Female Patients with T2DM
Table 7 Logistic Regression Analysis of the Association Between Male Patients with T2DM and Vitamin D Deficiency
Table 8 Logistic Regression Analysis of the Association Between Female Patients with T2DM and Vitamin D Deficiency
Table 9 ROC Curve Analysis of MHR in Predicting Vitamin D Deficiency in Male Patients with T2DM
Figure 5 ROC curve of MHR in male patients with T2DM and vitamin D deficiency.