
Figures & data
Figure 1 Flow chart of the study design.
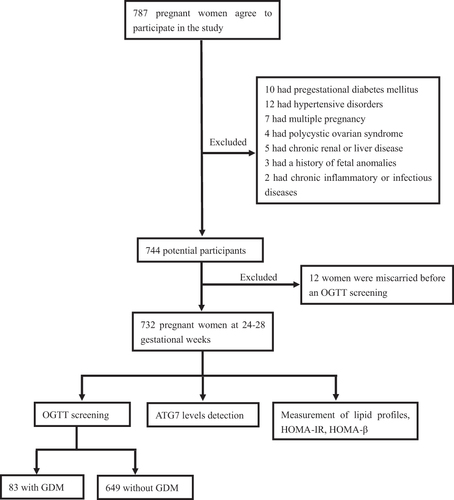
Table 1 Clinical and Laboratory Characteristics Between the GDM Group and Non-GDM Group
Table 2 Correlations of ATG7 Levels with Lipid Profiles and Glycemic Indices in the GDM Group
Table 3 Associations Between ATG7 Levels and Risk of GDM Assessed by Logistic Regression Models
Figure 2 Prevalence of GDM at each tertile of plasma ATG7 levels.
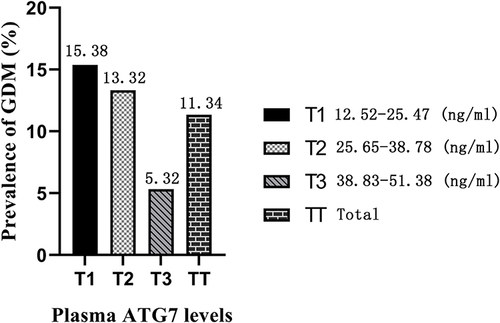
Table 4 Association Between ATG7 Levels and Insulin Resistance