Figures & data
Figure 1 Flowchart of the study design.
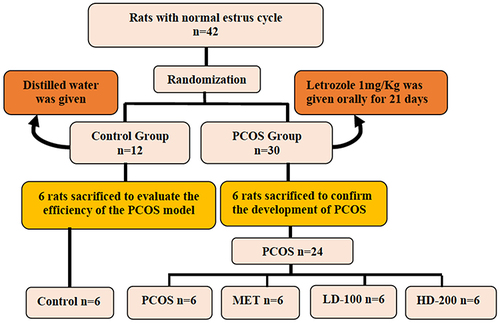
Figure 2 Vaginal cytology of rats showing phases of the estrus cycle with the cell type characterized as: (A) proestrus: consists of a predominance of nucleated epithelial cells; (B) estrus: cornified squamous epithelial cells; (C) metestrus: consists of mixed cells of leukocytes, nucleated cells (few), and cornified squamous epithelial cells; (D) diestrus: leukocytes are predominant.
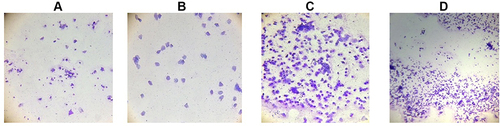
Table 1 Body Weight Changes of the Rats Throughout the Treatment Period
Table 2 Relative Ovarian and Uterine Weights, and Abdominal Fat Weight, on Day 40
Figure 3 Effect of silibinin on oral glucose tolerance test on (A) day 21 and (B) day 40.
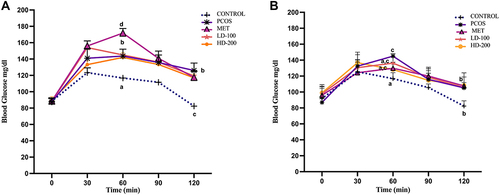
Table 3 Area Under the Curve for Oral Glucose Tolerance Test on Days 21 and 40
Figure 4 Effects of silibinin on serum insulin level on day 40.
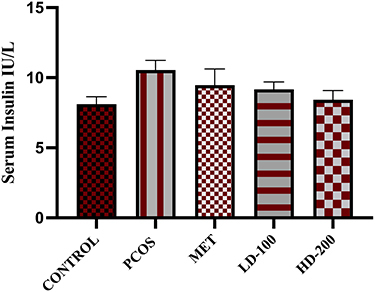
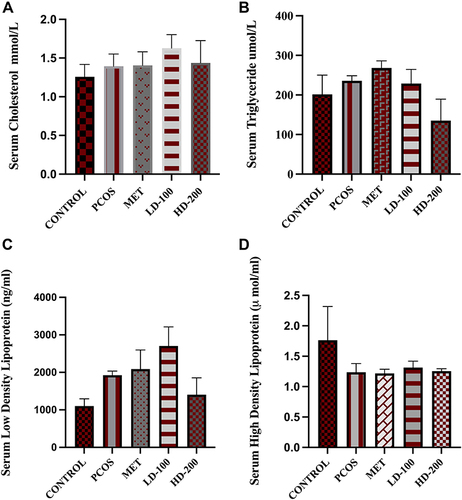
Figure 5 Effect of silibinin on lipid profile on day 40, including serum (A) cholesterol, (B) triglyceride, (C) low-density lipoprotein, (D) high-density lipoprotein.