
Figures & data
Figure 1 Flowchart of object selection. Of the 4222 residents who met the inclusion criteria, 3182 eligible individuals enrolled in this study, with the response rate of 75.4%. Finally, 3175 participants were included in this study after excluding seven residents with missing data.
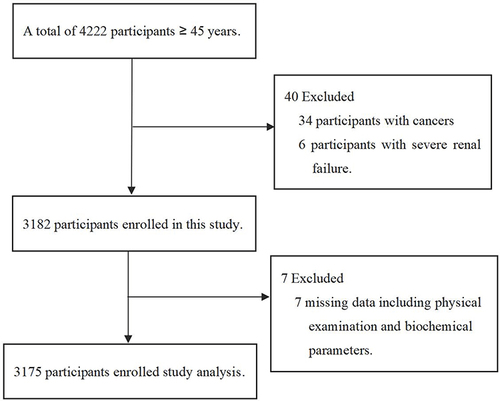
Table 1 Characteristics of Study Participants by Sex
Table 2 Characteristics of Metabolic Syndrome and Its Components
Table 3 The Univariate Analysis of Influence Factors for Metabolic Syndrome
Table 4 Risk Factors of Metabolic Syndrome in Multivariate Analysis
Table 5 The Sensitivity Analyses of the Association of Metabolic Syndrome with Relative Risk Factors