
Figures & data
Table 1 Clinical and Laboratory Characteristics of the Participants
Figure 1 TLR4 expression in peripheral blood mononuclear cells (PBMCs) (A) negative control, (B) control, (C) T2DM, and (D) T2DM+microalbuminuria groups. The percentage of double-positive cells stained with antibodies against CD14 and TLR4 was assessed by flow cytometry. The blank control was a tube without fluorescent antibodies.
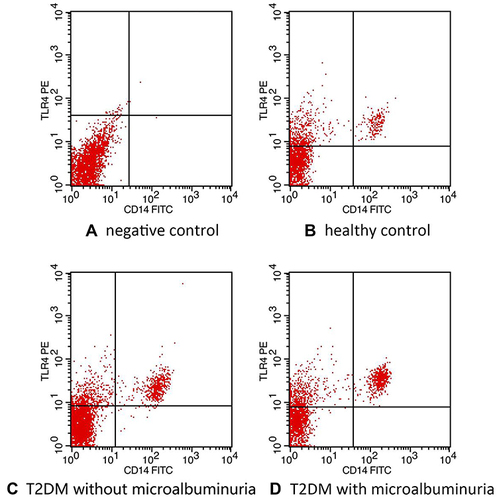
Table 2 Correlations of Serum LPS with Clinical and Laboratory Characteristics
Table 3 Correlations of UAER with Clinical and Laboratory Characteristics
Table 4 Correlations of TLR4 Expression with Clinical and Laboratory Characteristics
Table 5 Multivariate Stepwise Linear Regression Analysis of Factors Independently Associated with UAER
Table 6 Binary Logistic Regression Analysis of Risk Factors for Microalbuminuria in T2DM