Figures & data
Table 1 The Characteristics of the Investigated T2D Patients (the Results are Expressed as Median and Interquartile Range)
Figure 1 Relative frequency of the microbial population at the orders level in all investigated T2DM patients.
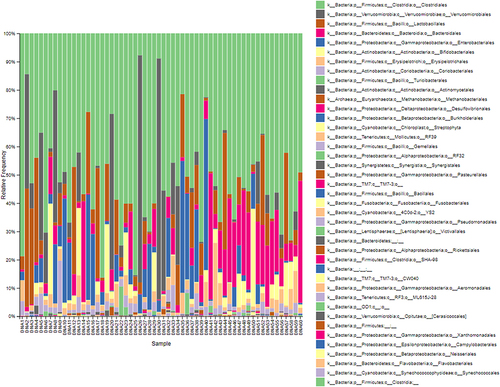
Figure 2 Percentages of the microbial population at the orders level of Metfromin group of T2DM patients.
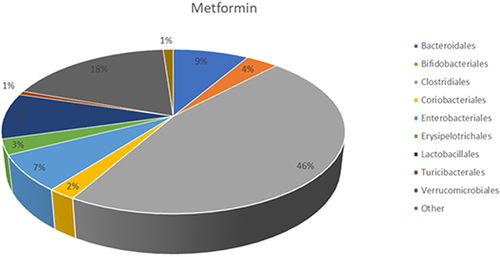
Figure 3 Percentages of the microbial population at the orders level of Metformin+Insulin group of T2DM patients.
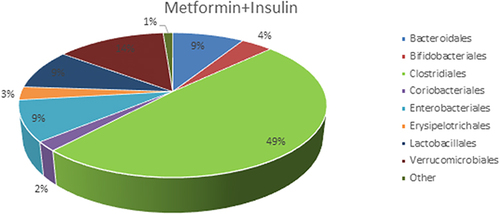
Figure 4 Percentages of the microbial population at the orders level of Metformin group of T2DM patients – The 1% from the other bacterial orders.
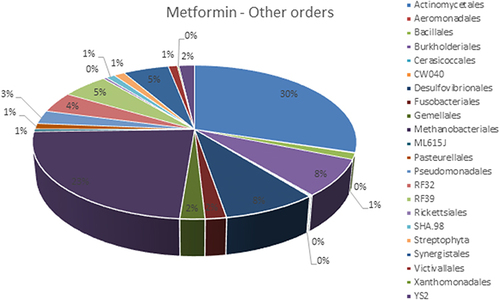
Figure 5 Percentages of the microbial population at the orders level of Metformin+Insulin group of T2DM patients – The 1% from the other bacterial orders.
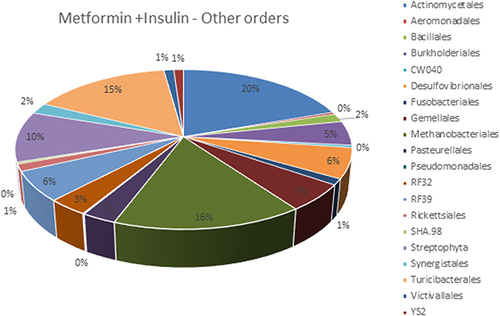
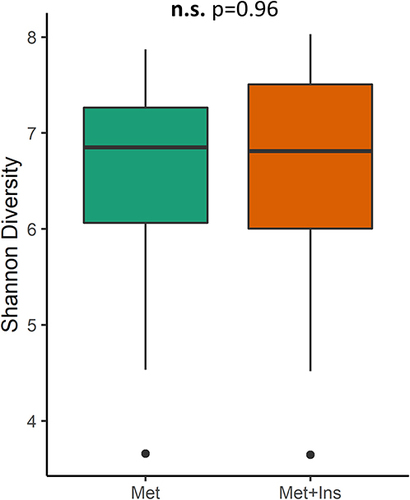
Figure 6 Shannon diversity of microbiome in investigated groups.