Figures & data
Figure 1 Flowchart of study selection. Preferred Reporting in Systematic Reviews and Meta-analyses (PRISMA) flowchart showing the study selection process.
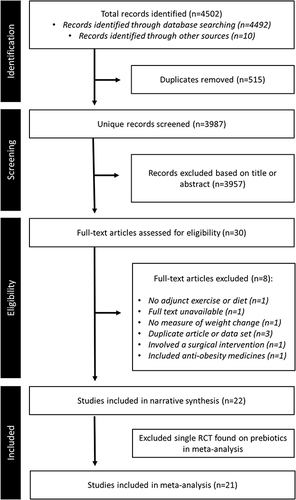
Table 1 Characteristics of Included Studies
Figure 2 Forest plots of the effects of probiotics. Forest plots of the effects of probiotics on (A) body weight; (B) BMI; (C) fat mass; and (D) waist circumference. Analyses consider the pooled mean difference (MD) between baseline and end-of-treatment in patients receiving microbiome-targeted therapies as an adjunct to exercise/diet compared with patients receiving exercise/diet only. MDs are presented with the 95% CI for each study and for the combined results.
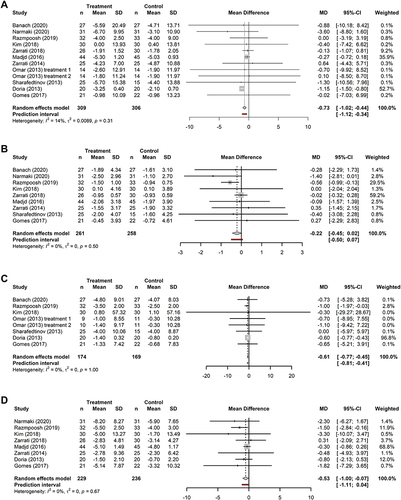
Figure 3 Forest plots of the effects of synbiotics. Forest plots of the effects of synbiotics on (A) body weight (kg); (B) BMI (kg/m2); (C) fat mass (kg); and (D) waist circumference (cm). Analyses consider the pooled mean difference (MD) between baseline and end-of-treatment in patients receiving microbiome-targeted therapies as an adjunct to exercise/diet compared with patients receiving exercise/diet only. MDs are presented with the 95% CI for each study and for the combined results.
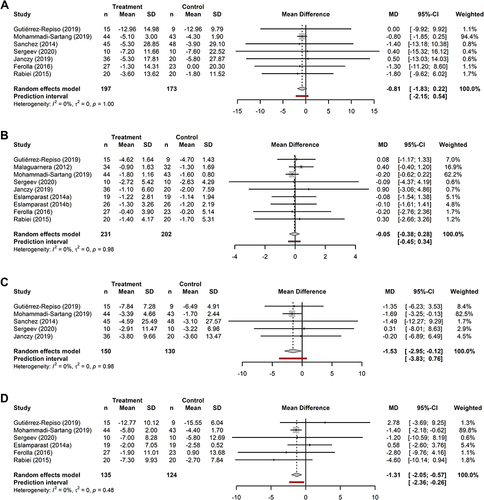
Figure 4 Risk of bias assessment using the RoB-2 tool. The risk was assessed using the Cochrane Collaboration’s tool for qualitatively assessing the risk of bias.Citation32 (A) Details of all included studies; (B) overall summary.
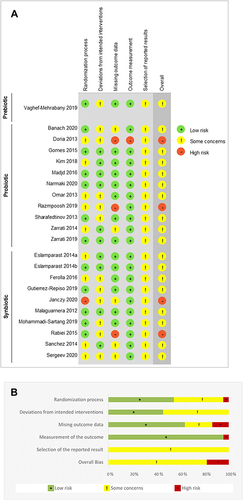
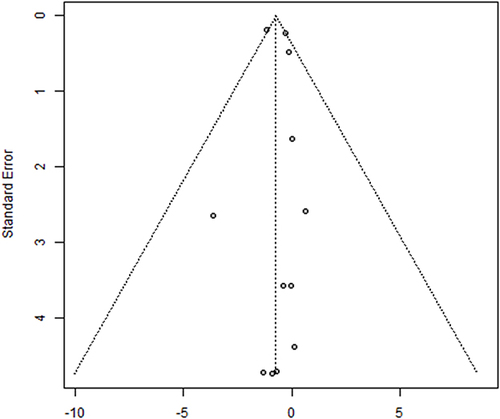
Figure 5 Funnel plot. Funnel plot for the meta-analysis of body weight in the probiotic group. The standard error and effect size are shown on the y- and x-axis, respectively. The circles represent the individual studies in the analysis.