Figures & data
Table 1 Clinical Parameters of Subjects According to the Presence or Absence of MetS
Figure 1 Analysis of circulating pigment epithelium-derived factor (PEDF) levels in different groups. Data are shown as the means ± SEs. *P<0.05.
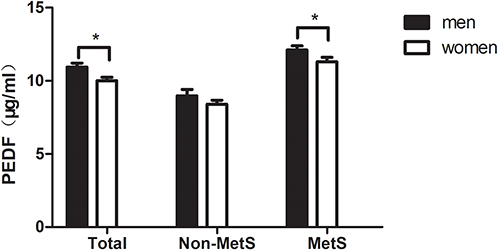
Table 2 Spearman Correlation Analysis of PEDF and Clinical Indices
Table 3 Stepwise Multivariate Regression Analysis of Serum PEDF Levels
Table 4 Multivariate Regression Analysis of Serum PEDF Levels in Women
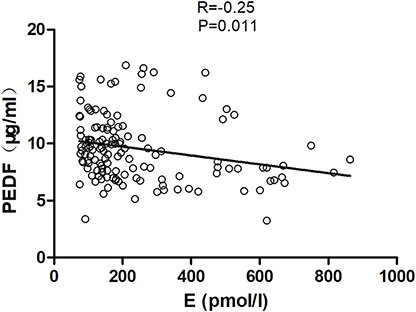
Figure 2 Correlation analysis of serum pigment epithelium-derived factor (PEDF) levels and estradiol (E) concentrations in women.