Figures & data
Figure 1 Identification of tsRNAs by small RNA sequencing. (A) Venn diagram based on the number of identified tsRNAs. (B) Venn diagram based on the number of commonly expressed and specifically expressed tsRNAs in the diabetes and control groups. (C) Pie chart of the distribution of subtype tsRNAs in the diabetes and control groups. (D) The number of subtype tsRNAs against tRNA isodecoders.
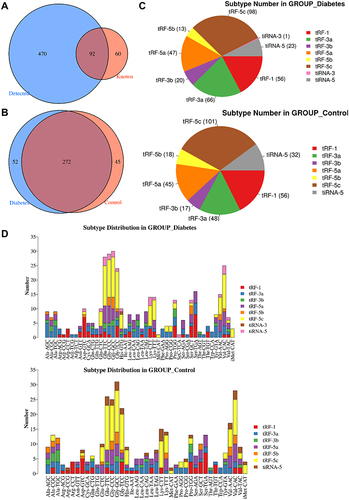
Figure 2 Differential expression profiles of tsRNAs induced by diabetes. (A) The volcano plot of differentially expressed tsRNAs between the diabetes and control groups. (B) The unsupervised hierarchical clustering heatmap for differentially expressed tsRNAs between the diabetes and control groups. (C) Top 20 GO enrichment terms of differentially expressed tsRNAs. (D) The KEGG pathway enrichment results for differentially expressed tsRNAs are shown for top 20 entries.
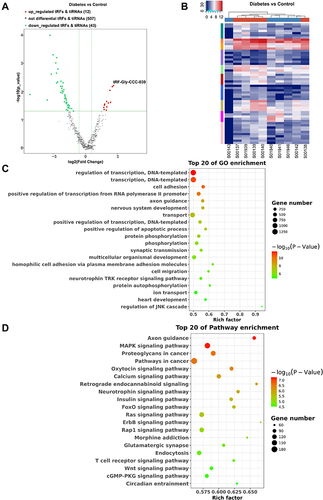
Figure 3 Network analyses of tRF-Gly-CCC-039. (A) RT-qPCR verified six differentially expressed tsRNAs. (B) Relative expression of tRF-Gly-CCC-039 in HUVECs after induction by normal and high glucose detected by RT-qPCR. (C) Relative expression of tRF-Phe-GAA-001 in HUVECs after induction by normal and high glucose detected by RT-qPCR. (D) The network of the tRF-Gly-CCC-039-mRNA pathway. ns p > 0.05, *p < 0.05, **p < 0.01, ***p < 0.001.
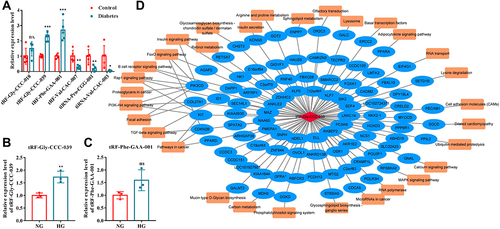
Figure 4 Detailed information of tRF-Gly-CCC-039 in MINTbase v2.0. (A) The tRF-Gly-CCC-039 is a 5′-tRF fragment with two genomic locations. (B) Abundance of tRF-Phe-GAA-001 in different cancers from the TCGA database.
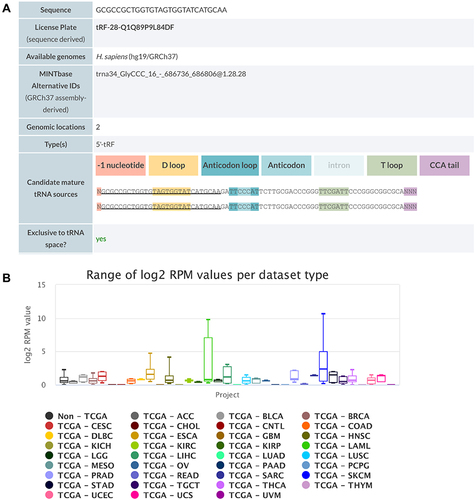
Figure 5 tRF-Gly-CCC-039 mimic transfection aggravates high-glucose-induced impairment in HUVECs. (A) Relative expression of tRF-Gly-CCC-039 in HUVECs after transfection of tRF-Gly-CCC-039 mimics or mimic NC. (B) The proliferation of HUVECs was detected by using the EdU assay. (C) The migration ability of HUVECs was detected by using the wound-healing assay. (D) The tube-formation ability of HUVECs was detected by using the Matrigel tube-formation assay. (E) Matrix associated gene expression (Col1a1, Col4a2, and MMP9) in HUVECs was detected by using RT-qPCR. Gray represents the NG group; yellow represents the HG group; red represents the HG + tsRNA mimic NC group; and blue represents the HG + tsRNA mimic group. *p < 0.05, **p < 0.01, ***p < 0.001.
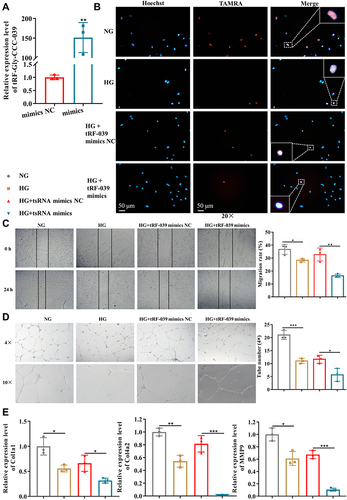
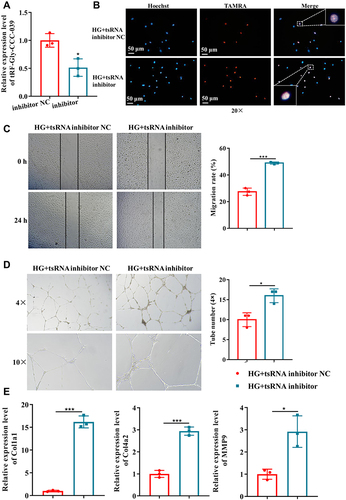
Figure 6 tRF-Gly-CCC-039 inhibitor suppressed high-glucose-induced impairment in HUVECs. (A) Relative expression of tRF-Gly-CCC-039 in HUVECs after transfection of the tRF-Gly-CCC-039 inhibitor or inhibitor NC. (B) The proliferation of HUVECs after transfection of the tRF-Gly-CCC-039 inhibitor or NC was detected by using the EdU assay. (C) The migration ability of HUVECs after transfection of the tRF-Gly-CCC-039 inhibitor or NC was detected by using the wound-healing assay. (D) The tube-formation ability of HUVECs after transfection of the tRF-Gly-CCC-039 inhibitor or NC was detected by using the Matrigel tube-formation assay. (E) Matrix-associated gene expression (Col1a1, Col4a2, and MMP9) in HUVECs after transfection of the tRF-Gly-CCC-039 inhibitor or NC was detected by using RT-qPCR. Red represents the HG + tsRNA inhibitor NC group, and blue represents the HG + tsRNA inhibitor group. *p < 0.05, ***p < 0.001.