Figures & data
Table 1 Primer Sequence
Figure 1 Effects of Shuangdan Mingmu (SDMM)capsules on retinal structure in STZ-induced diabetic rats. (A) retinal HE-stained images; (B) retinal cell counts in GCL; (C) retinal thickness from RPE to GCL; (D) Images of retinal PAS staining. χ±s, n=3, **p<0.01, ****p<0.0001, scale bar 100um.
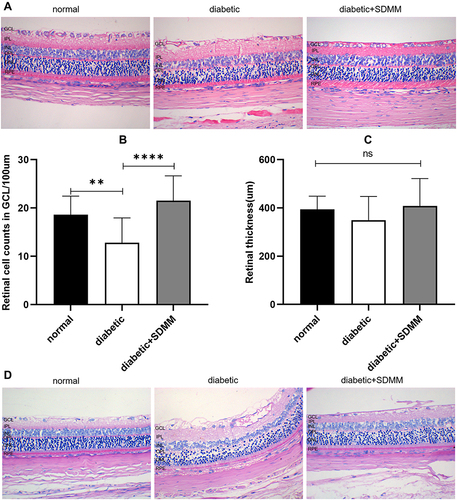
Figure 2 Effects of Shuangdan Mingmu (SDMM) capsules on STZ-induced retinal apoptosis in diabetic rats. (A) Images of retinal TUNEL staining; (B-D) AI of INL, GCL and ONL, respectively, in each group. Positive signal is green fluorescence, blue is nuclear staining signal, AI = number of apoptotic cells/number of total cells×100%. χ±s, n=3, *p<0.05, **p<0.01, ***p=0.0001, ****p<0.0001, scale bar 100um.
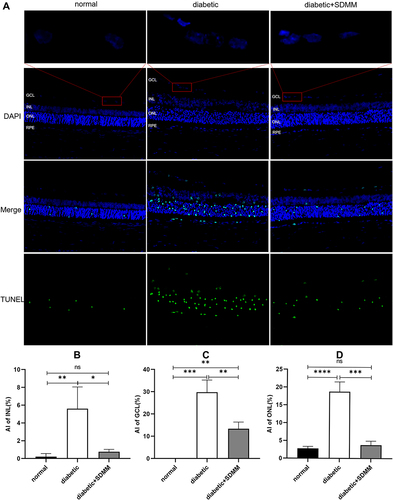
Figure 3 MiRNA expression profiling was performed using miRNA sequencing. (A) Heatmap of differentially expressed miRNAs. (C is the normal group, M is the diabetic group, ZY is the diabetic+SDMM group). miRNA expression levels are depicted in red (up-regulated) and blue (down-regulated); (B and C) The logFC value of different miRNAs compared between the diabetic group and the normal group (B) and between the diabetic+SDMM group and the diabetic group (C).
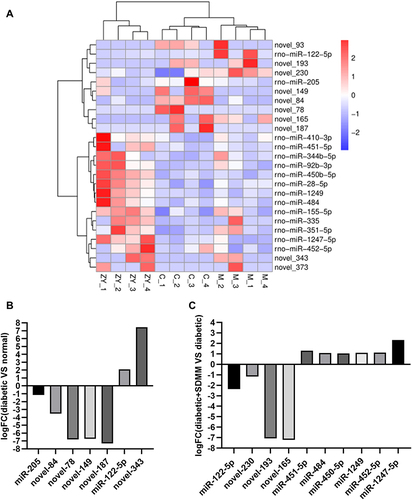
Figure 4 GO and KEGG analysis. Functional enrichment analysis (A and B) and KEGG analysis (C and D) of differentially expressed miRNA target genes between the diabetic group and the normal group, the diabetic group and the diabetic+SDMM capsule group.
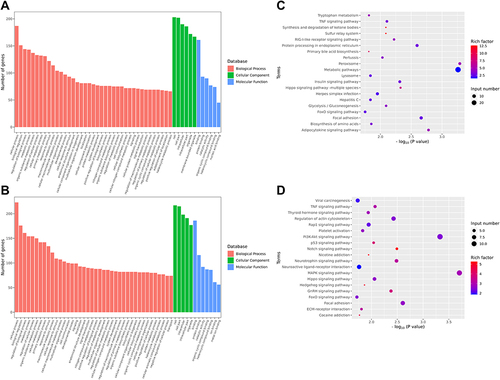
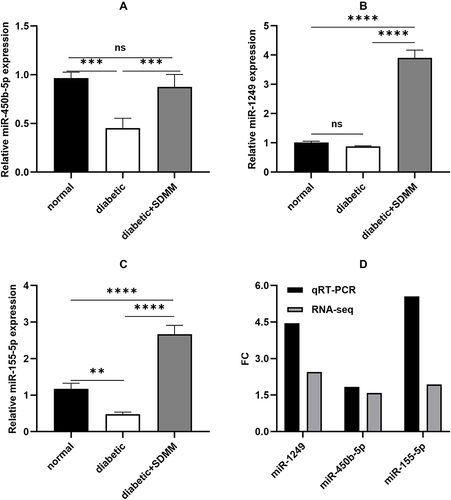
Figure 5 qRT-PCR validation of miRNA expression changes. qRT-PCR detection of (A) the relative expression levels of miR-450b-5p, (B) miR-1249, (C) miR-155-5p, and (D) FC (Fold Change) values of 3 miRNAs in qRT-PCR and RNA sequencing, FC>1.5 indicates up-regulation (±s, n=4, **p<0.01, ***p=0.0001, ****p<0.0001).