Figures & data
Table 1 The Primer Sequences Used in This Study
Figure 1 Hepatic FST level was elevated in NAFLD liver samples compared to normal liver samples. (A) H&E staining of liver sections in NAFLD and normal liver samples (200×, scale bar: 100 µm). (B and C) Immunohistochemical staining and analysis result of hepatic FST in NAFLD and normal liver samples (400×, scale bar: 50 µm). (D) Immunofluorescence staining of hepatic FST in NAFLD and normal liver samples. (630×, scale bar: 20 µm). (E and F) The protein level and analysis result of hepatic FST in NAFLD and normal liver samples. β-actin was used as a loading control.
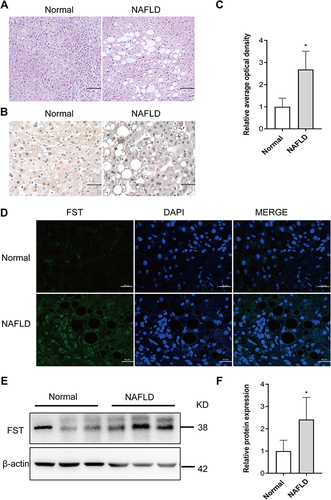
Figure 2 FST expression increased in the FFA-treated human liver (LO2) cells. (A) CCK-8 assay results showed the viability of LO2 cells treated with different concentrations of FFA. (B and C) Oil red O staining and analysis result of LO2 cells with the control (CON) and 1 mM FFA treatment (400×, scale bar: 50 µm). (D and E) The protein expression and analysis results of FST, ACC1, FASN, SREBP1, and ChREBP in LO2 cells with the control and 1 mM FFA treatment. β-actin was used as a loading control.
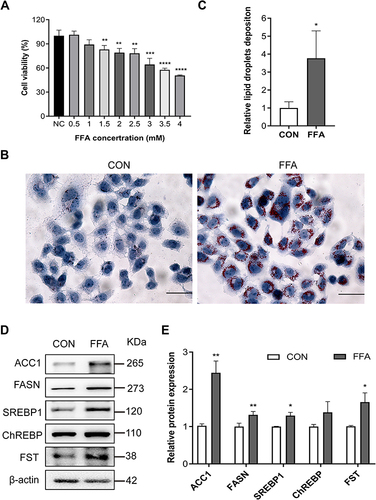
Figure 3 FST overexpression decreased lipid accumulation in FFA-treated LO2 cells. (A and B) The efficiency of FST overexpression in LO2 cells was demonstrated by RT-qPCR and Western blotting. (C and D) Oil red O staining and analysis result of control cells (EGFP) and FST-overexpressing LO2 cells treated with 1.0 mM FFA for 24 h (400×, scale bar=50 µm). (E–G) The protein levels and analysis results of ACC1, FASN, SREBP1, ChREBP, Akt, Akt-Thr308, Akt-Ser473, p-mTOR, and mTOR in the control cells and FST-overexpressing LO2 cells treated with 1 mM FFA for 24h. β-actin was used as a loading control.
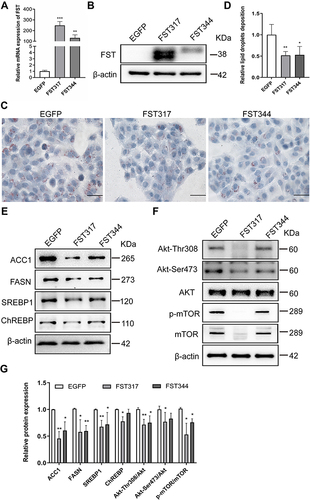
Figure 4 FST knockdown aggravated lipid accumulation in LO2 cells and this effect was inhibited by rapamycin. (A and B) The efficiency of FST knockdown in LO2 cells was demonstrated by RT-qPCR and Western blotting. (C and D) Oil Red O staining and analysis results of FFA-treated negative control shRNA (NCsh) cells, FFA-treated FST-knockdown (FSTsh) cells, and FFA- and rapamycin-treated FSTsh (FSTsh+RAPA) cells (400×, scale bar: 50 µm). (E and F) The protein levels and analysis results of Akt, Akt-Thr308, Akt-Ser473, p-mTOR, and mTOR in FFA-treated NCsh cells and FFA-treated FSTsh cells. (G and H) The protein levels and analysis results of ACC1, FASN, SREBP1, ChREBP, and mTOR in NCsh, FSTsh, FSTsh+RAPA cells. β-actin was used as a loading control.
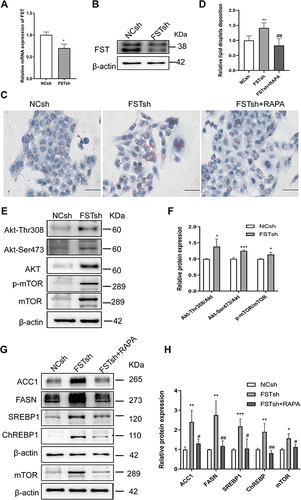
Figure 5 Establishment and characterization of NAFLD mice model fed with HFD. (A) The schematic diagram of mice experiments. (B) Body weight of NCD and HFD mice. (C and D) GTT and ITT results in NCD and HFD mice. (E and F) AUC for GTT and ITT. (G) H&E and Oil Red O staining in NCD and HFD mice (200×, scale bar: 100 µm). The marks represented the main pathohistological findings.
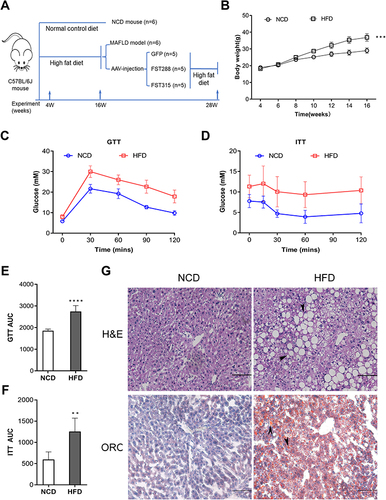
Figure 6 Hepatic FST expression increased in HFD mice. (A and B) The hepatic protein levels and analysis results of FST, ACC1, FASN, SREBP1, and ChREBP in NCD and HFD mice. β-actin was used as a loading control. (C) Immunohistochemical staining of hepatic FST in NCD and HFD mice (400×, scale bar= 50 µm).
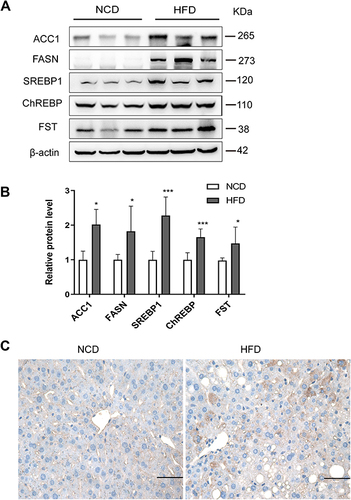
Figure 7 FST overexpression alleviated hepatic steatosis in HFD mice. (A) Hepatic FST mRNA expression in the control (treated with an AAV vector encoding GFP) and FST-overexpressing (treated with an AAV vector encoding FST288 and FST315) HFD mice. (B) Body weight of the control and FST-overexpressing HFD mice. (C and D) H&E and oil red O staining in the liver sections of the control and FST-overexpressing HFD mice. (200×, scale bar=100 µm). The marks represented the main pathohistological difference. (E–L) The serum levels of T-CHO, TG, glucose, ALT, AST, FST, insulin, and C-peptide in the control and FST-overexpressing HFD mice.
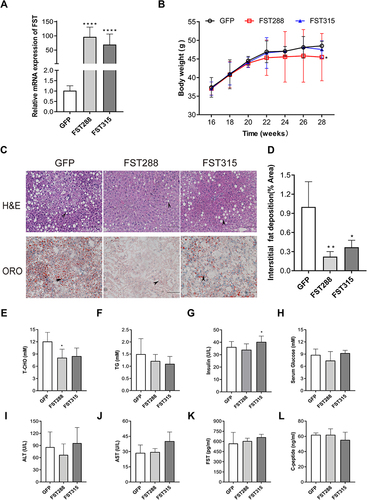
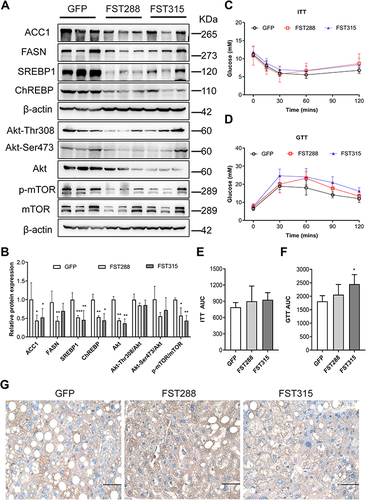
Figure 8 FST overexpression inhibited lipid synthesis and Akt/mTOR pathway in HFD mice. (A and B) The protein expression and analysis results of ACC1, FASN, SREBP1, ChREBP, Akt, Akt-Thr308, Akt-Ser473, p-mTOR, and mTOR in the control (treated with an AAV vector encoding GFP) and FST-overexpressing (treated with an AAV vector encoding FST288 and FST315) HFD mice. β-actin was used as a loading control. (C and D) GTT and ITT results in the control and FST-overexpressing HFD mice. (E and F) AUC for GTT and ITT. (G) Immunohistochemical staining of hepatic FST in the control and FST-overexpressing HFD mice (400×, scale bar: 50 µm).