Figures & data
Table 1 Baseline Characteristics of Participants According to Quartiles of SF at 16–18th Weeks of Gestation
Table 2 Odds Ratios (95% Confidence Intervals) for the Occurrence of GDM According to the SF at 16–18th Weeks of Gestation
Table 3 Odds Ratios (95% Confidence Intervals) for the Occurrence of Adverse Maternal and Fetal Outcomes According to the SF at 16–18th Weeks of Gestation
Table 4 Odds Ratios (95% Confidence Intervals) for the Occurrence of Adverse Maternal and Fetal Outcomes According to the SF at 28–32th Weeks of Gestation
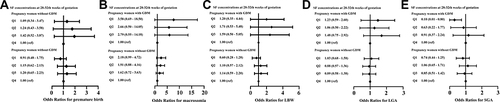
Figure 1 The association between SF and the risk of adverse pregnancy outcomes among pregnancy women with and without GDM. The model was adjusted for age, BMI, education background, smoking status, alcohol consumption status, conception method, parity, abortion history, thalassemia history and hemoglobin.