
Figures & data
Table 1 Grid Search Parameter Intervals for Model Training
Figure 1 Flowchart of the model training and test procedure in this study.
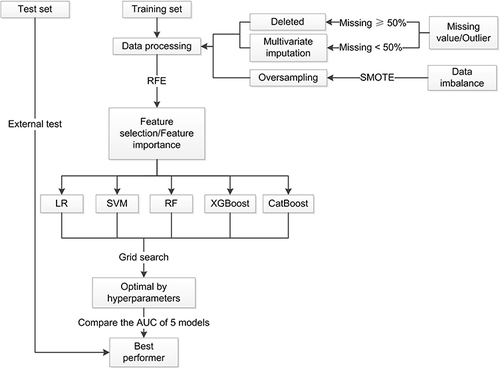
Figure 2 Distribution of missing features in the training set and test set.
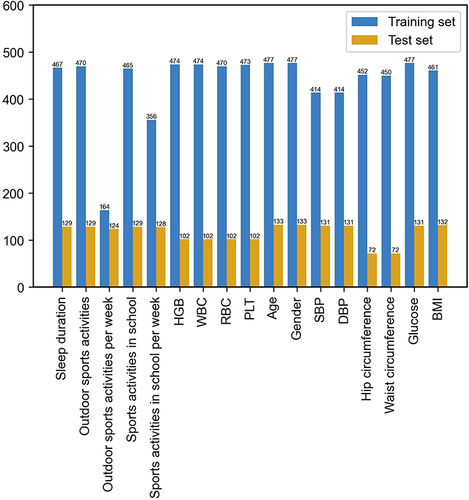
Table 2 Feature Comparison Between the Training Set and Test Set- Continuous Variables (Mean± SD)
Table 3 Feature Comparison Between the Training Set and Test Set - Categorical Variables
Figure 3 Violin plot depicting the comparison of basic information between the training set and the external test set.
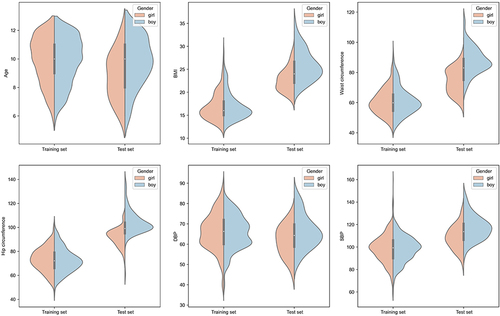
Table 4 Features Selected by Different Models, Displayed in Descending Order of Importance Percentage
Figure 4 Feature selection for different models by the RFE method. (A) LR; (B) RF; (C) SVM; (D) XGBoost; (E) CatBoost.
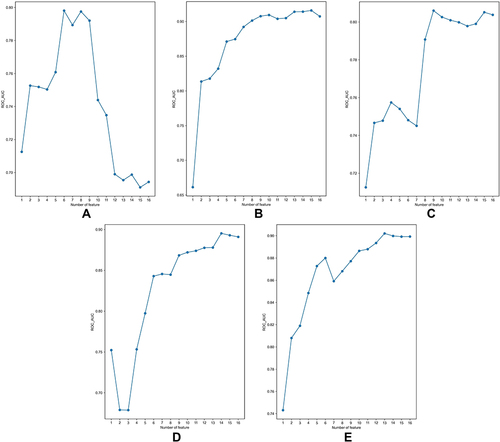
Figure 5 ROC curves for the test set.
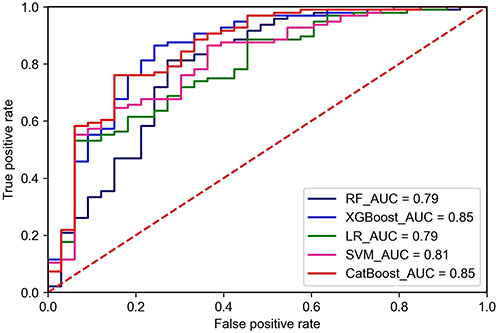
Table 5 Evaluation Metrics for the Different Models